Yaqui vs Immigrants from Thailand Unemployment Among Youth under 25 years
COMPARE
Yaqui
Immigrants from Thailand
Unemployment Among Youth under 25 years
Unemployment Among Youth under 25 years Comparison
Yaqui
Immigrants from Thailand
11.9%
UNEMPLOYMENT AMONG YOUTH UNDER 25 YEARS
6.9/ 100
METRIC RATING
217th/ 347
METRIC RANK
11.3%
UNEMPLOYMENT AMONG YOUTH UNDER 25 YEARS
93.6/ 100
METRIC RATING
102nd/ 347
METRIC RANK
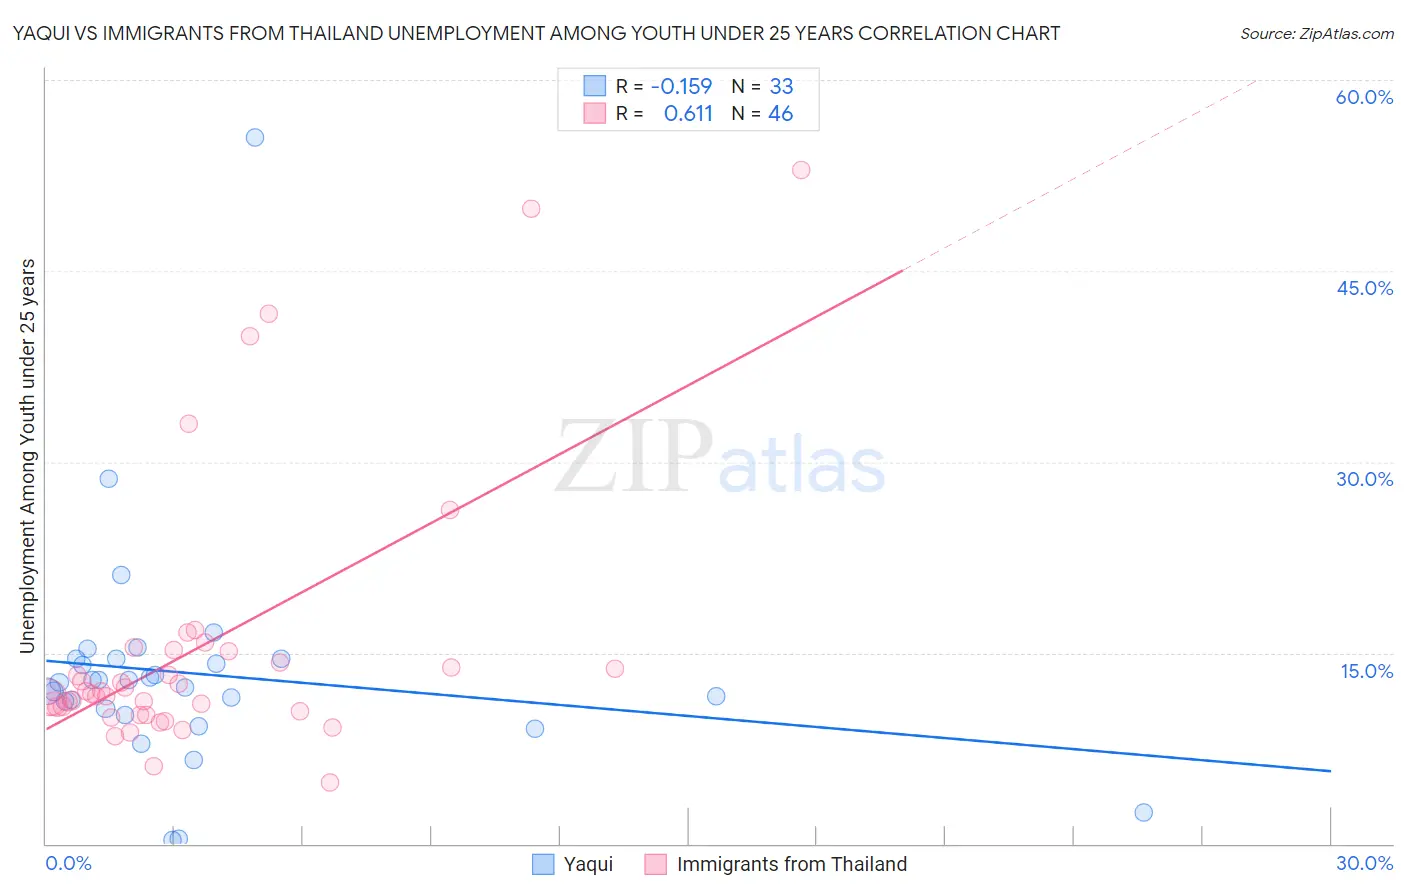
Yaqui vs Immigrants from Thailand Unemployment Among Youth under 25 years Correlation Chart
The statistical analysis conducted on geographies consisting of 107,339,892 people shows a poor negative correlation between the proportion of Yaqui and unemployment rate among youth under the age of 25 in the United States with a correlation coefficient (R) of -0.159 and weighted average of 11.9%. Similarly, the statistical analysis conducted on geographies consisting of 314,872,704 people shows a significant positive correlation between the proportion of Immigrants from Thailand and unemployment rate among youth under the age of 25 in the United States with a correlation coefficient (R) of 0.611 and weighted average of 11.3%, a difference of 5.6%.
Unemployment Among Youth under 25 years Correlation Summary
| Measurement | Yaqui | Immigrants from Thailand |
| Minimum | 0.30% | 4.8% |
| Maximum | 55.5% | 52.9% |
| Range | 55.2% | 48.1% |
| Mean | 13.3% | 15.4% |
| Median | 12.6% | 11.9% |
| Interquartile 25% (IQ1) | 10.4% | 10.4% |
| Interquartile 75% (IQ3) | 14.5% | 15.1% |
| Interquartile Range (IQR) | 4.1% | 4.7% |
| Standard Deviation (Sample) | 9.2% | 10.7% |
| Standard Deviation (Population) | 9.0% | 10.6% |
Similar Demographics by Unemployment Among Youth under 25 years
Demographics Similar to Yaqui by Unemployment Among Youth under 25 years
In terms of unemployment among youth under 25 years, the demographic groups most similar to Yaqui are Guamanian/Chamorro (11.9%, a difference of 0.010%), Immigrants from Middle Africa (11.9%, a difference of 0.010%), Samoan (11.9%, a difference of 0.070%), Nonimmigrants (11.9%, a difference of 0.12%), and Alsatian (11.9%, a difference of 0.14%).
| Demographics | Rating | Rank | Unemployment Among Youth under 25 years |
| Assyrians/Chaldeans/Syriacs | 9.8 /100 | #210 | Tragic 11.9% |
| Immigrants | Philippines | 9.2 /100 | #211 | Tragic 11.9% |
| Colombians | 9.1 /100 | #212 | Tragic 11.9% |
| South Americans | 8.5 /100 | #213 | Tragic 11.9% |
| Costa Ricans | 8.2 /100 | #214 | Tragic 11.9% |
| Samoans | 7.4 /100 | #215 | Tragic 11.9% |
| Guamanians/Chamorros | 7.0 /100 | #216 | Tragic 11.9% |
| Yaqui | 6.9 /100 | #217 | Tragic 11.9% |
| Immigrants | Middle Africa | 6.8 /100 | #218 | Tragic 11.9% |
| Immigrants | Nonimmigrants | 6.2 /100 | #219 | Tragic 11.9% |
| Alsatians | 6.1 /100 | #220 | Tragic 11.9% |
| Immigrants | Portugal | 4.9 /100 | #221 | Tragic 12.0% |
| Israelis | 4.1 /100 | #222 | Tragic 12.0% |
| Immigrants | Ireland | 3.5 /100 | #223 | Tragic 12.0% |
| Hawaiians | 3.5 /100 | #224 | Tragic 12.0% |
Demographics Similar to Immigrants from Thailand by Unemployment Among Youth under 25 years
In terms of unemployment among youth under 25 years, the demographic groups most similar to Immigrants from Thailand are Immigrants from Malaysia (11.3%, a difference of 0.0%), Immigrants from Afghanistan (11.3%, a difference of 0.020%), Iroquois (11.3%, a difference of 0.050%), Pakistani (11.3%, a difference of 0.070%), and Immigrants from Jordan (11.3%, a difference of 0.070%).
| Demographics | Rating | Rank | Unemployment Among Youth under 25 years |
| Carpatho Rusyns | 94.4 /100 | #95 | Exceptional 11.3% |
| Immigrants | Serbia | 94.4 /100 | #96 | Exceptional 11.3% |
| Nicaraguans | 94.3 /100 | #97 | Exceptional 11.3% |
| Estonians | 94.2 /100 | #98 | Exceptional 11.3% |
| Celtics | 94.0 /100 | #99 | Exceptional 11.3% |
| Pakistanis | 94.0 /100 | #100 | Exceptional 11.3% |
| Iroquois | 93.8 /100 | #101 | Exceptional 11.3% |
| Immigrants | Thailand | 93.6 /100 | #102 | Exceptional 11.3% |
| Immigrants | Malaysia | 93.6 /100 | #103 | Exceptional 11.3% |
| Immigrants | Afghanistan | 93.4 /100 | #104 | Exceptional 11.3% |
| Immigrants | Jordan | 93.1 /100 | #105 | Exceptional 11.3% |
| Chileans | 93.0 /100 | #106 | Exceptional 11.3% |
| Immigrants | Lithuania | 92.9 /100 | #107 | Exceptional 11.3% |
| Immigrants | Kuwait | 92.9 /100 | #108 | Exceptional 11.3% |
| Iranians | 92.0 /100 | #109 | Exceptional 11.3% |