Yakama vs Immigrants from Armenia Unemployment Among Youth under 25 years
COMPARE
Yakama
Immigrants from Armenia
Unemployment Among Youth under 25 years
Unemployment Among Youth under 25 years Comparison
Yakama
Immigrants from Armenia
15.6%
UNEMPLOYMENT AMONG YOUTH UNDER 25 YEARS
0.0/ 100
METRIC RATING
330th/ 347
METRIC RANK
14.4%
UNEMPLOYMENT AMONG YOUTH UNDER 25 YEARS
0.0/ 100
METRIC RATING
313th/ 347
METRIC RANK
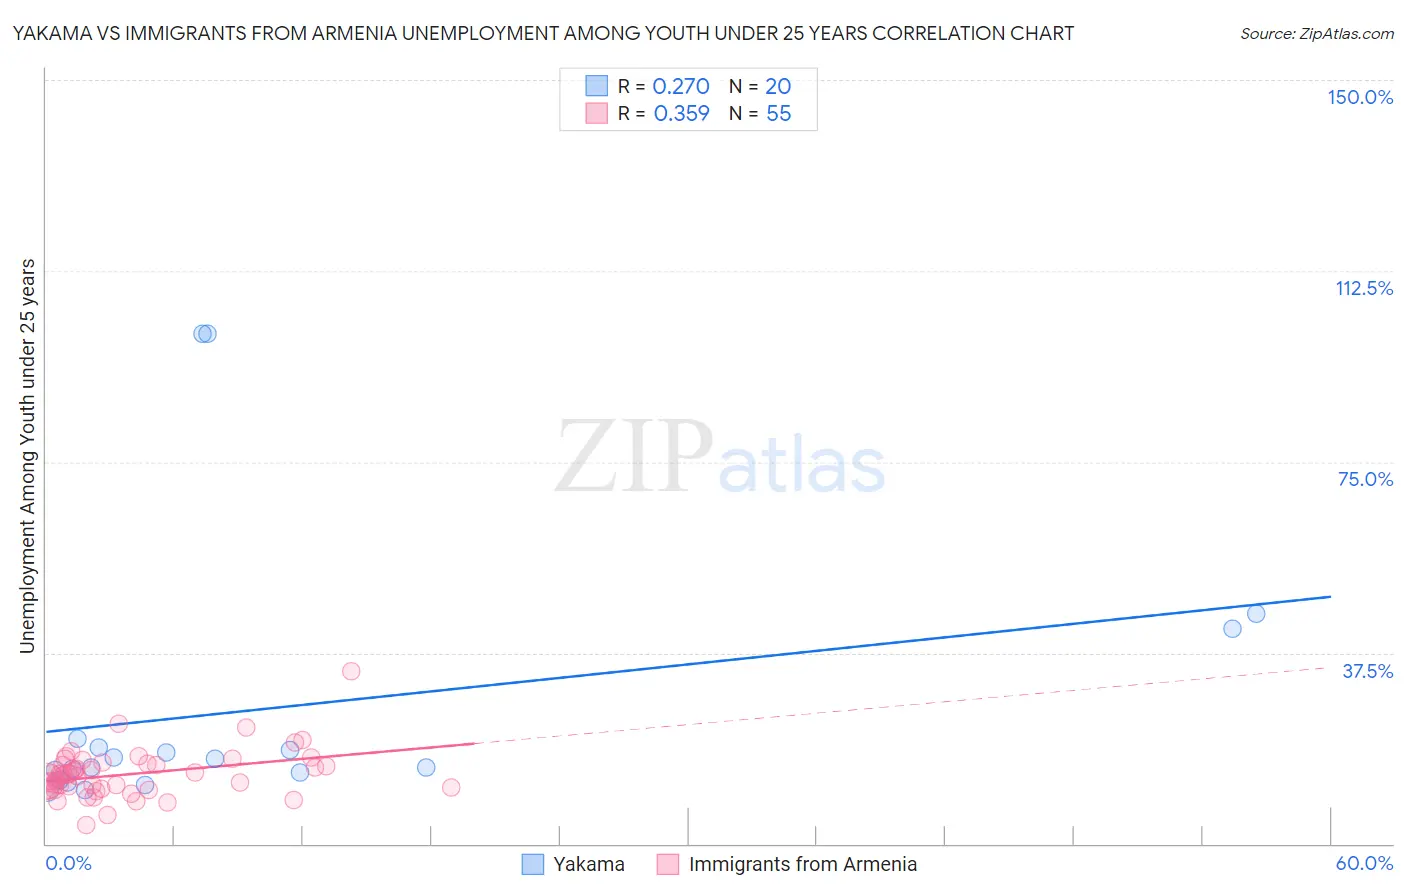
Yakama vs Immigrants from Armenia Unemployment Among Youth under 25 years Correlation Chart
The statistical analysis conducted on geographies consisting of 19,840,397 people shows a weak positive correlation between the proportion of Yakama and unemployment rate among youth under the age of 25 in the United States with a correlation coefficient (R) of 0.270 and weighted average of 15.6%. Similarly, the statistical analysis conducted on geographies consisting of 97,450,391 people shows a mild positive correlation between the proportion of Immigrants from Armenia and unemployment rate among youth under the age of 25 in the United States with a correlation coefficient (R) of 0.359 and weighted average of 14.4%, a difference of 8.5%.
Unemployment Among Youth under 25 years Correlation Summary
| Measurement | Yakama | Immigrants from Armenia |
| Minimum | 10.6% | 3.6% |
| Maximum | 100.1% | 34.0% |
| Range | 89.5% | 30.4% |
| Mean | 26.4% | 13.7% |
| Median | 15.9% | 13.6% |
| Interquartile 25% (IQ1) | 13.3% | 10.7% |
| Interquartile 75% (IQ3) | 19.9% | 15.6% |
| Interquartile Range (IQR) | 6.6% | 4.9% |
| Standard Deviation (Sample) | 26.8% | 4.7% |
| Standard Deviation (Population) | 26.2% | 4.7% |
Demographics Similar to Yakama and Immigrants from Armenia by Unemployment Among Youth under 25 years
In terms of unemployment among youth under 25 years, the demographic groups most similar to Yakama are Immigrants from Yemen (15.6%, a difference of 0.040%), Immigrants from Dominican Republic (15.6%, a difference of 0.17%), British West Indian (15.5%, a difference of 0.28%), Dominican (15.7%, a difference of 0.83%), and Immigrants from Barbados (15.2%, a difference of 2.3%). Similarly, the demographic groups most similar to Immigrants from Armenia are Jamaican (14.4%, a difference of 0.090%), Sioux (14.4%, a difference of 0.20%), Native/Alaskan (14.5%, a difference of 0.63%), Black/African American (14.5%, a difference of 0.71%), and Vietnamese (14.3%, a difference of 0.83%).
| Demographics | Rating | Rank | Unemployment Among Youth under 25 years |
| Immigrants | Bangladesh | 0.0 /100 | #311 | Tragic 14.2% |
| Vietnamese | 0.0 /100 | #312 | Tragic 14.3% |
| Immigrants | Armenia | 0.0 /100 | #313 | Tragic 14.4% |
| Jamaicans | 0.0 /100 | #314 | Tragic 14.4% |
| Sioux | 0.0 /100 | #315 | Tragic 14.4% |
| Natives/Alaskans | 0.0 /100 | #316 | Tragic 14.5% |
| Blacks/African Americans | 0.0 /100 | #317 | Tragic 14.5% |
| Immigrants | Dominica | 0.0 /100 | #318 | Tragic 14.6% |
| West Indians | 0.0 /100 | #319 | Tragic 14.6% |
| Barbadians | 0.0 /100 | #320 | Tragic 14.6% |
| Cheyenne | 0.0 /100 | #321 | Tragic 14.6% |
| Trinidadians and Tobagonians | 0.0 /100 | #322 | Tragic 14.6% |
| Immigrants | Trinidad and Tobago | 0.0 /100 | #323 | Tragic 14.6% |
| Immigrants | Jamaica | 0.0 /100 | #324 | Tragic 14.8% |
| Alaska Natives | 0.0 /100 | #325 | Tragic 14.9% |
| Immigrants | Barbados | 0.0 /100 | #326 | Tragic 15.2% |
| British West Indians | 0.0 /100 | #327 | Tragic 15.5% |
| Immigrants | Dominican Republic | 0.0 /100 | #328 | Tragic 15.6% |
| Immigrants | Yemen | 0.0 /100 | #329 | Tragic 15.6% |
| Yakama | 0.0 /100 | #330 | Tragic 15.6% |
| Dominicans | 0.0 /100 | #331 | Tragic 15.7% |