White/Caucasian vs Black/African American Unemployment Among Ages 55 to 59 years
COMPARE
White/Caucasian
Black/African American
Unemployment Among Ages 55 to 59 years
Unemployment Among Ages 55 to 59 years Comparison
Whites/Caucasians
Blacks/African Americans
4.7%
UNEMPLOYMENT AMONG AGES 55 TO 59 YEARS
90.7/ 100
METRIC RATING
119th/ 347
METRIC RANK
5.5%
UNEMPLOYMENT AMONG AGES 55 TO 59 YEARS
0.0/ 100
METRIC RATING
304th/ 347
METRIC RANK
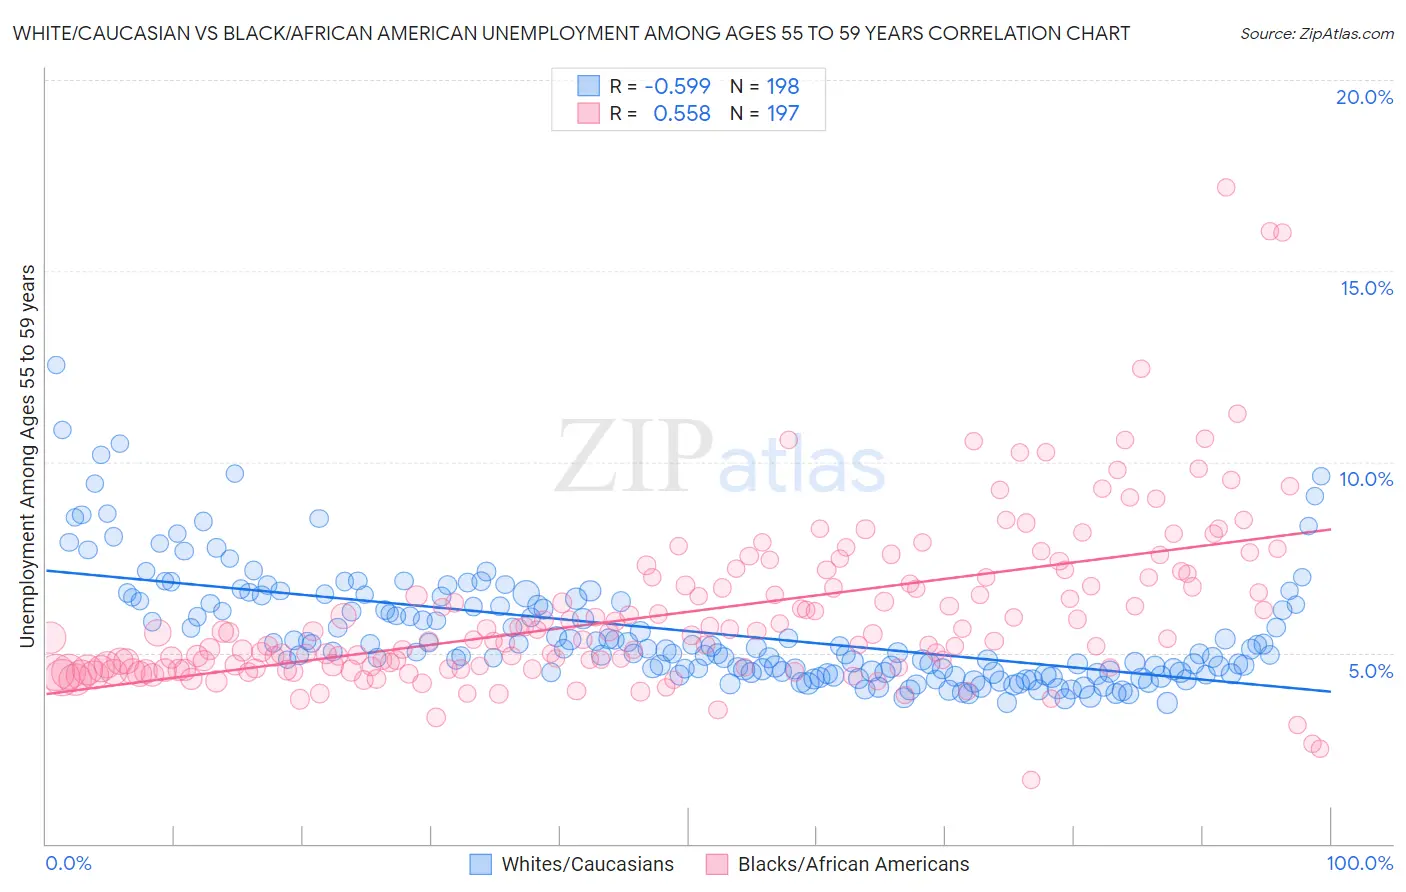
White/Caucasian vs Black/African American Unemployment Among Ages 55 to 59 years Correlation Chart
The statistical analysis conducted on geographies consisting of 492,133,782 people shows a substantial negative correlation between the proportion of Whites/Caucasians and unemployment rate among population between the ages 55 and 59 in the United States with a correlation coefficient (R) of -0.599 and weighted average of 4.7%. Similarly, the statistical analysis conducted on geographies consisting of 486,654,676 people shows a substantial positive correlation between the proportion of Blacks/African Americans and unemployment rate among population between the ages 55 and 59 in the United States with a correlation coefficient (R) of 0.558 and weighted average of 5.5%, a difference of 16.9%.
Unemployment Among Ages 55 to 59 years Correlation Summary
| Measurement | White/Caucasian | Black/African American |
| Minimum | 3.7% | 1.7% |
| Maximum | 12.5% | 17.2% |
| Range | 8.8% | 15.5% |
| Mean | 5.6% | 6.0% |
| Median | 5.1% | 5.4% |
| Interquartile 25% (IQ1) | 4.5% | 4.6% |
| Interquartile 75% (IQ3) | 6.3% | 7.0% |
| Interquartile Range (IQR) | 1.9% | 2.4% |
| Standard Deviation (Sample) | 1.5% | 2.2% |
| Standard Deviation (Population) | 1.5% | 2.2% |
Similar Demographics by Unemployment Among Ages 55 to 59 years
Demographics Similar to Whites/Caucasians by Unemployment Among Ages 55 to 59 years
In terms of unemployment among ages 55 to 59 years, the demographic groups most similar to Whites/Caucasians are Immigrants from Chile (4.7%, a difference of 0.0%), Turkish (4.7%, a difference of 0.020%), Asian (4.7%, a difference of 0.020%), South American Indian (4.7%, a difference of 0.030%), and Bangladeshi (4.7%, a difference of 0.080%).
| Demographics | Rating | Rank | Unemployment Among Ages 55 to 59 years |
| Afghans | 92.1 /100 | #112 | Exceptional 4.7% |
| Immigrants | Spain | 91.4 /100 | #113 | Exceptional 4.7% |
| Bangladeshis | 91.3 /100 | #114 | Exceptional 4.7% |
| South American Indians | 90.9 /100 | #115 | Exceptional 4.7% |
| Turks | 90.9 /100 | #116 | Exceptional 4.7% |
| Asians | 90.8 /100 | #117 | Exceptional 4.7% |
| Immigrants | Chile | 90.7 /100 | #118 | Exceptional 4.7% |
| Whites/Caucasians | 90.7 /100 | #119 | Exceptional 4.7% |
| Immigrants | South Africa | 89.9 /100 | #120 | Excellent 4.7% |
| Pakistanis | 89.7 /100 | #121 | Excellent 4.7% |
| Immigrants | Afghanistan | 89.5 /100 | #122 | Excellent 4.7% |
| Immigrants | Japan | 89.4 /100 | #123 | Excellent 4.7% |
| Lithuanians | 88.8 /100 | #124 | Excellent 4.7% |
| Immigrants | Malaysia | 87.9 /100 | #125 | Excellent 4.7% |
| Immigrants | Serbia | 87.8 /100 | #126 | Excellent 4.7% |
Demographics Similar to Blacks/African Americans by Unemployment Among Ages 55 to 59 years
In terms of unemployment among ages 55 to 59 years, the demographic groups most similar to Blacks/African Americans are Immigrants from Portugal (5.5%, a difference of 0.17%), Immigrants from Cabo Verde (5.5%, a difference of 0.29%), Immigrants from Belize (5.5%, a difference of 0.51%), Marshallese (5.5%, a difference of 0.52%), and Sierra Leonean (5.5%, a difference of 0.53%).
| Demographics | Rating | Rank | Unemployment Among Ages 55 to 59 years |
| Immigrants | Mexico | 0.0 /100 | #297 | Tragic 5.3% |
| Hispanics or Latinos | 0.0 /100 | #298 | Tragic 5.4% |
| Cape Verdeans | 0.0 /100 | #299 | Tragic 5.4% |
| Immigrants | St. Vincent and the Grenadines | 0.0 /100 | #300 | Tragic 5.4% |
| Immigrants | Dominica | 0.0 /100 | #301 | Tragic 5.5% |
| Sierra Leoneans | 0.0 /100 | #302 | Tragic 5.5% |
| Marshallese | 0.0 /100 | #303 | Tragic 5.5% |
| Blacks/African Americans | 0.0 /100 | #304 | Tragic 5.5% |
| Immigrants | Portugal | 0.0 /100 | #305 | Tragic 5.5% |
| Immigrants | Cabo Verde | 0.0 /100 | #306 | Tragic 5.5% |
| Immigrants | Belize | 0.0 /100 | #307 | Tragic 5.5% |
| Spanish American Indians | 0.0 /100 | #308 | Tragic 5.6% |
| Nepalese | 0.0 /100 | #309 | Tragic 5.6% |
| Belizeans | 0.0 /100 | #310 | Tragic 5.6% |
| Houma | 0.0 /100 | #311 | Tragic 5.6% |