West Indian vs Immigrants from Singapore Unemployment Among Ages 55 to 59 years
COMPARE
West Indian
Immigrants from Singapore
Unemployment Among Ages 55 to 59 years
Unemployment Among Ages 55 to 59 years Comparison
West Indians
Immigrants from Singapore
5.2%
UNEMPLOYMENT AMONG AGES 55 TO 59 YEARS
0.0/ 100
METRIC RATING
276th/ 347
METRIC RANK
4.8%
UNEMPLOYMENT AMONG AGES 55 TO 59 YEARS
76.6/ 100
METRIC RATING
147th/ 347
METRIC RANK
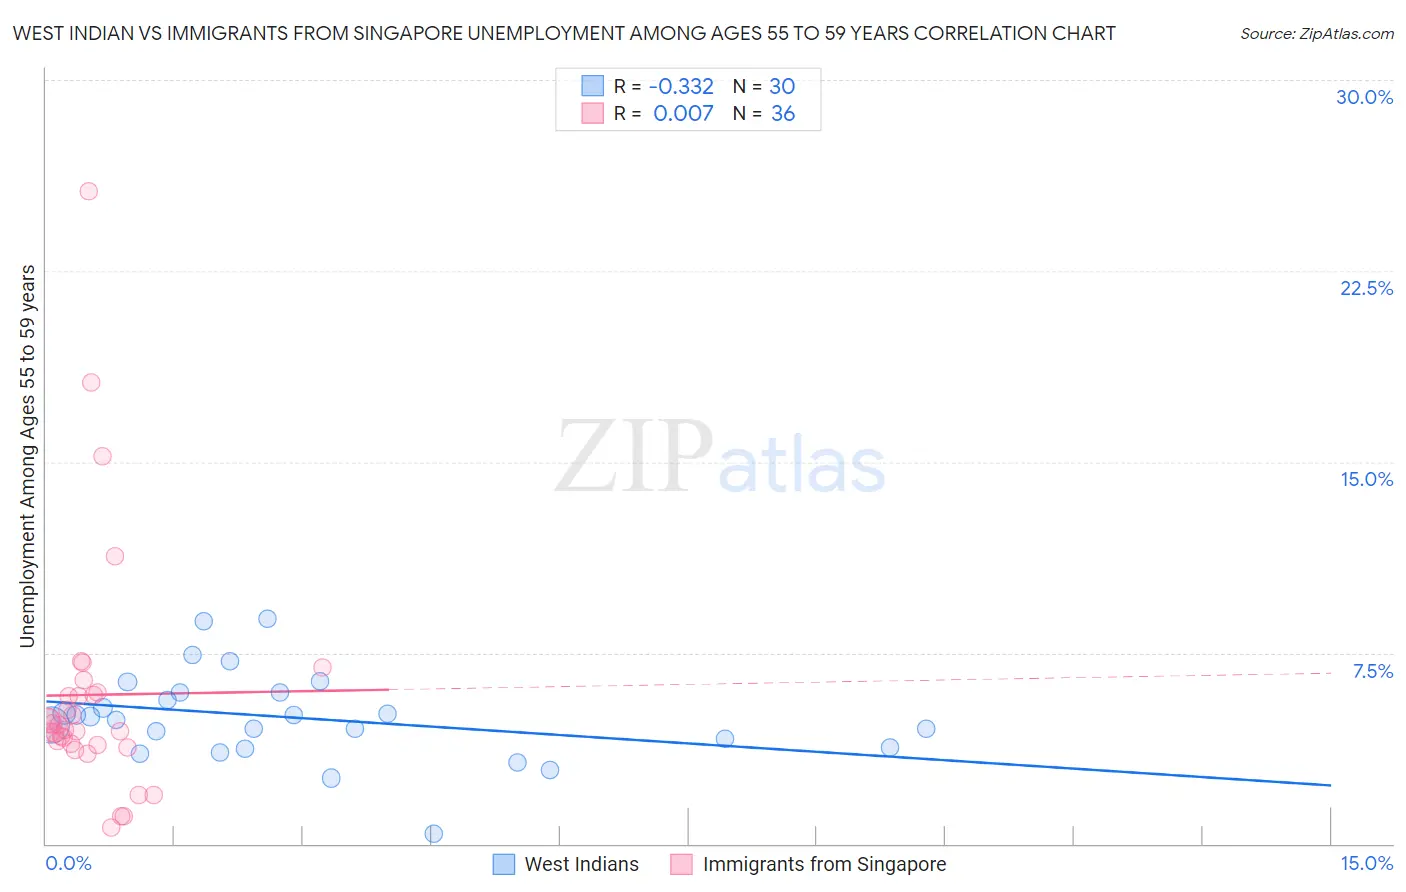
West Indian vs Immigrants from Singapore Unemployment Among Ages 55 to 59 years Correlation Chart
The statistical analysis conducted on geographies consisting of 243,325,614 people shows a mild negative correlation between the proportion of West Indians and unemployment rate among population between the ages 55 and 59 in the United States with a correlation coefficient (R) of -0.332 and weighted average of 5.2%. Similarly, the statistical analysis conducted on geographies consisting of 134,284,256 people shows no correlation between the proportion of Immigrants from Singapore and unemployment rate among population between the ages 55 and 59 in the United States with a correlation coefficient (R) of 0.007 and weighted average of 4.8%, a difference of 9.7%.
Unemployment Among Ages 55 to 59 years Correlation Summary
| Measurement | West Indian | Immigrants from Singapore |
| Minimum | 0.40% | 0.62% |
| Maximum | 8.8% | 25.6% |
| Range | 8.4% | 25.0% |
| Mean | 4.9% | 5.9% |
| Median | 4.9% | 4.6% |
| Interquartile 25% (IQ1) | 3.8% | 3.9% |
| Interquartile 75% (IQ3) | 5.9% | 5.9% |
| Interquartile Range (IQR) | 2.1% | 2.0% |
| Standard Deviation (Sample) | 1.8% | 4.8% |
| Standard Deviation (Population) | 1.7% | 4.8% |
Similar Demographics by Unemployment Among Ages 55 to 59 years
Demographics Similar to West Indians by Unemployment Among Ages 55 to 59 years
In terms of unemployment among ages 55 to 59 years, the demographic groups most similar to West Indians are Israeli (5.2%, a difference of 0.010%), Mexican American Indian (5.2%, a difference of 0.11%), Immigrants from Latin America (5.2%, a difference of 0.12%), Ottawa (5.2%, a difference of 0.23%), and Immigrants from Barbados (5.2%, a difference of 0.30%).
| Demographics | Rating | Rank | Unemployment Among Ages 55 to 59 years |
| Tsimshian | 0.1 /100 | #269 | Tragic 5.2% |
| Ute | 0.1 /100 | #270 | Tragic 5.2% |
| Cree | 0.1 /100 | #271 | Tragic 5.2% |
| Immigrants | Jamaica | 0.0 /100 | #272 | Tragic 5.2% |
| Ottawa | 0.0 /100 | #273 | Tragic 5.2% |
| Mexican American Indians | 0.0 /100 | #274 | Tragic 5.2% |
| Israelis | 0.0 /100 | #275 | Tragic 5.2% |
| West Indians | 0.0 /100 | #276 | Tragic 5.2% |
| Immigrants | Latin America | 0.0 /100 | #277 | Tragic 5.2% |
| Immigrants | Barbados | 0.0 /100 | #278 | Tragic 5.2% |
| Alsatians | 0.0 /100 | #279 | Tragic 5.2% |
| Immigrants | Uzbekistan | 0.0 /100 | #280 | Tragic 5.3% |
| Guatemalans | 0.0 /100 | #281 | Tragic 5.3% |
| Immigrants | Trinidad and Tobago | 0.0 /100 | #282 | Tragic 5.3% |
| Apache | 0.0 /100 | #283 | Tragic 5.3% |
Demographics Similar to Immigrants from Singapore by Unemployment Among Ages 55 to 59 years
In terms of unemployment among ages 55 to 59 years, the demographic groups most similar to Immigrants from Singapore are Immigrants from South Eastern Asia (4.8%, a difference of 0.050%), Immigrants from Northern Europe (4.8%, a difference of 0.060%), Immigrants from Asia (4.8%, a difference of 0.070%), Ukrainian (4.8%, a difference of 0.12%), and Immigrants from Norway (4.8%, a difference of 0.19%).
| Demographics | Rating | Rank | Unemployment Among Ages 55 to 59 years |
| Immigrants | Indonesia | 80.2 /100 | #140 | Excellent 4.8% |
| French Canadians | 80.1 /100 | #141 | Excellent 4.8% |
| Immigrants | Norway | 79.8 /100 | #142 | Good 4.8% |
| Ukrainians | 78.6 /100 | #143 | Good 4.8% |
| Immigrants | Asia | 77.8 /100 | #144 | Good 4.8% |
| Immigrants | Northern Europe | 77.5 /100 | #145 | Good 4.8% |
| Immigrants | South Eastern Asia | 77.4 /100 | #146 | Good 4.8% |
| Immigrants | Singapore | 76.6 /100 | #147 | Good 4.8% |
| Immigrants | Bahamas | 71.8 /100 | #148 | Good 4.8% |
| Immigrants | Lithuania | 70.8 /100 | #149 | Good 4.8% |
| Immigrants | Northern Africa | 69.8 /100 | #150 | Good 4.8% |
| Bahamians | 68.6 /100 | #151 | Good 4.8% |
| Laotians | 68.2 /100 | #152 | Good 4.8% |
| Immigrants | Uruguay | 67.2 /100 | #153 | Good 4.8% |
| Immigrants | Panama | 66.8 /100 | #154 | Good 4.8% |