Welsh vs Scotch-Irish Unemployment Among Youth under 25 years
COMPARE
Welsh
Scotch-Irish
Unemployment Among Youth under 25 years
Unemployment Among Youth under 25 years Comparison
Welsh
Scotch-Irish
10.9%
UNEMPLOYMENT AMONG YOUTH UNDER 25 YEARS
99.7/ 100
METRIC RATING
44th/ 347
METRIC RANK
11.1%
UNEMPLOYMENT AMONG YOUTH UNDER 25 YEARS
98.8/ 100
METRIC RATING
58th/ 347
METRIC RANK
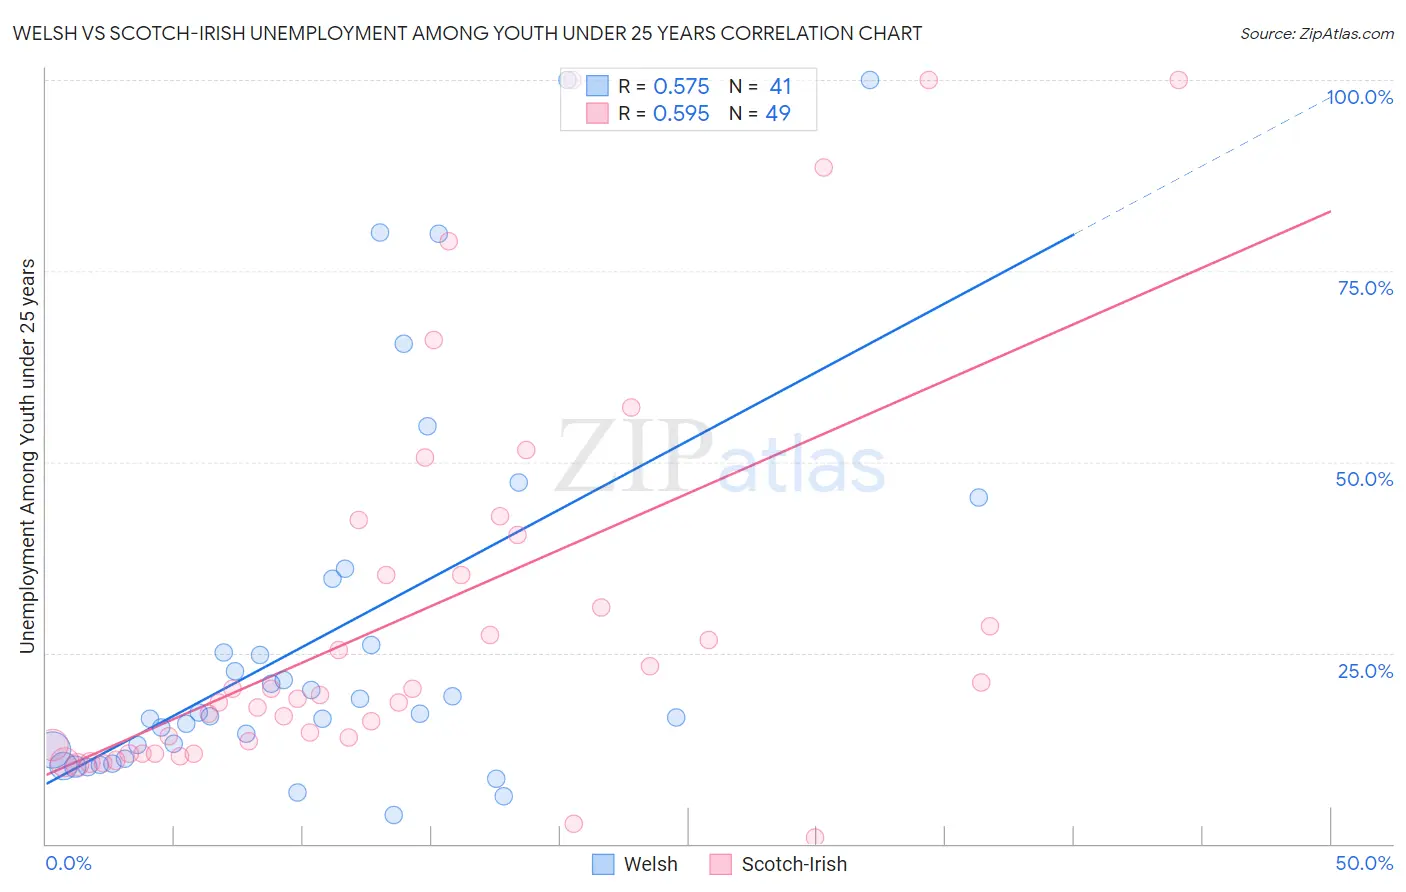
Welsh vs Scotch-Irish Unemployment Among Youth under 25 years Correlation Chart
The statistical analysis conducted on geographies consisting of 510,760,413 people shows a substantial positive correlation between the proportion of Welsh and unemployment rate among youth under the age of 25 in the United States with a correlation coefficient (R) of 0.575 and weighted average of 10.9%. Similarly, the statistical analysis conducted on geographies consisting of 527,464,403 people shows a substantial positive correlation between the proportion of Scotch-Irish and unemployment rate among youth under the age of 25 in the United States with a correlation coefficient (R) of 0.595 and weighted average of 11.1%, a difference of 1.4%.
Unemployment Among Youth under 25 years Correlation Summary
| Measurement | Welsh | Scotch-Irish |
| Minimum | 3.8% | 0.80% |
| Maximum | 100.0% | 100.0% |
| Range | 96.2% | 99.2% |
| Mean | 27.2% | 29.8% |
| Median | 17.0% | 19.4% |
| Interquartile 25% (IQ1) | 11.8% | 12.4% |
| Interquartile 75% (IQ3) | 30.4% | 37.9% |
| Interquartile Range (IQR) | 18.6% | 25.5% |
| Standard Deviation (Sample) | 24.9% | 25.8% |
| Standard Deviation (Population) | 24.6% | 25.6% |
Demographics Similar to Welsh and Scotch-Irish by Unemployment Among Youth under 25 years
In terms of unemployment among youth under 25 years, the demographic groups most similar to Welsh are British (10.9%, a difference of 0.020%), Bulgarian (10.9%, a difference of 0.10%), Tongan (10.9%, a difference of 0.14%), Australian (10.9%, a difference of 0.19%), and Cambodian (10.9%, a difference of 0.28%). Similarly, the demographic groups most similar to Scotch-Irish are Immigrants from Eritrea (11.1%, a difference of 0.040%), Immigrants from Saudi Arabia (11.1%, a difference of 0.050%), Immigrants from Eastern Africa (11.1%, a difference of 0.060%), Mongolian (11.1%, a difference of 0.070%), and Irish (11.1%, a difference of 0.070%).
| Demographics | Rating | Rank | Unemployment Among Youth under 25 years |
| Croatians | 99.8 /100 | #41 | Exceptional 10.9% |
| Cambodians | 99.7 /100 | #42 | Exceptional 10.9% |
| British | 99.7 /100 | #43 | Exceptional 10.9% |
| Welsh | 99.7 /100 | #44 | Exceptional 10.9% |
| Bulgarians | 99.6 /100 | #45 | Exceptional 10.9% |
| Tongans | 99.6 /100 | #46 | Exceptional 10.9% |
| Australians | 99.6 /100 | #47 | Exceptional 10.9% |
| Poles | 99.3 /100 | #48 | Exceptional 11.0% |
| Thais | 99.3 /100 | #49 | Exceptional 11.0% |
| Czechoslovakians | 99.2 /100 | #50 | Exceptional 11.0% |
| Serbians | 99.0 /100 | #51 | Exceptional 11.0% |
| Latvians | 99.0 /100 | #52 | Exceptional 11.0% |
| Ottawa | 99.0 /100 | #53 | Exceptional 11.1% |
| Mongolians | 98.9 /100 | #54 | Exceptional 11.1% |
| Irish | 98.9 /100 | #55 | Exceptional 11.1% |
| Immigrants | Saudi Arabia | 98.8 /100 | #56 | Exceptional 11.1% |
| Immigrants | Eritrea | 98.8 /100 | #57 | Exceptional 11.1% |
| Scotch-Irish | 98.8 /100 | #58 | Exceptional 11.1% |
| Immigrants | Eastern Africa | 98.7 /100 | #59 | Exceptional 11.1% |
| South Africans | 98.5 /100 | #60 | Exceptional 11.1% |
| Filipinos | 98.3 /100 | #61 | Exceptional 11.1% |