Vietnamese vs Hopi Unemployment Among Ages 30 to 34 years
COMPARE
Vietnamese
Hopi
Unemployment Among Ages 30 to 34 years
Unemployment Among Ages 30 to 34 years Comparison
Vietnamese
Hopi
6.5%
UNEMPLOYMENT AMONG AGES 30 TO 34 YEARS
0.0/ 100
METRIC RATING
292nd/ 347
METRIC RANK
11.9%
UNEMPLOYMENT AMONG AGES 30 TO 34 YEARS
0.0/ 100
METRIC RATING
344th/ 347
METRIC RANK
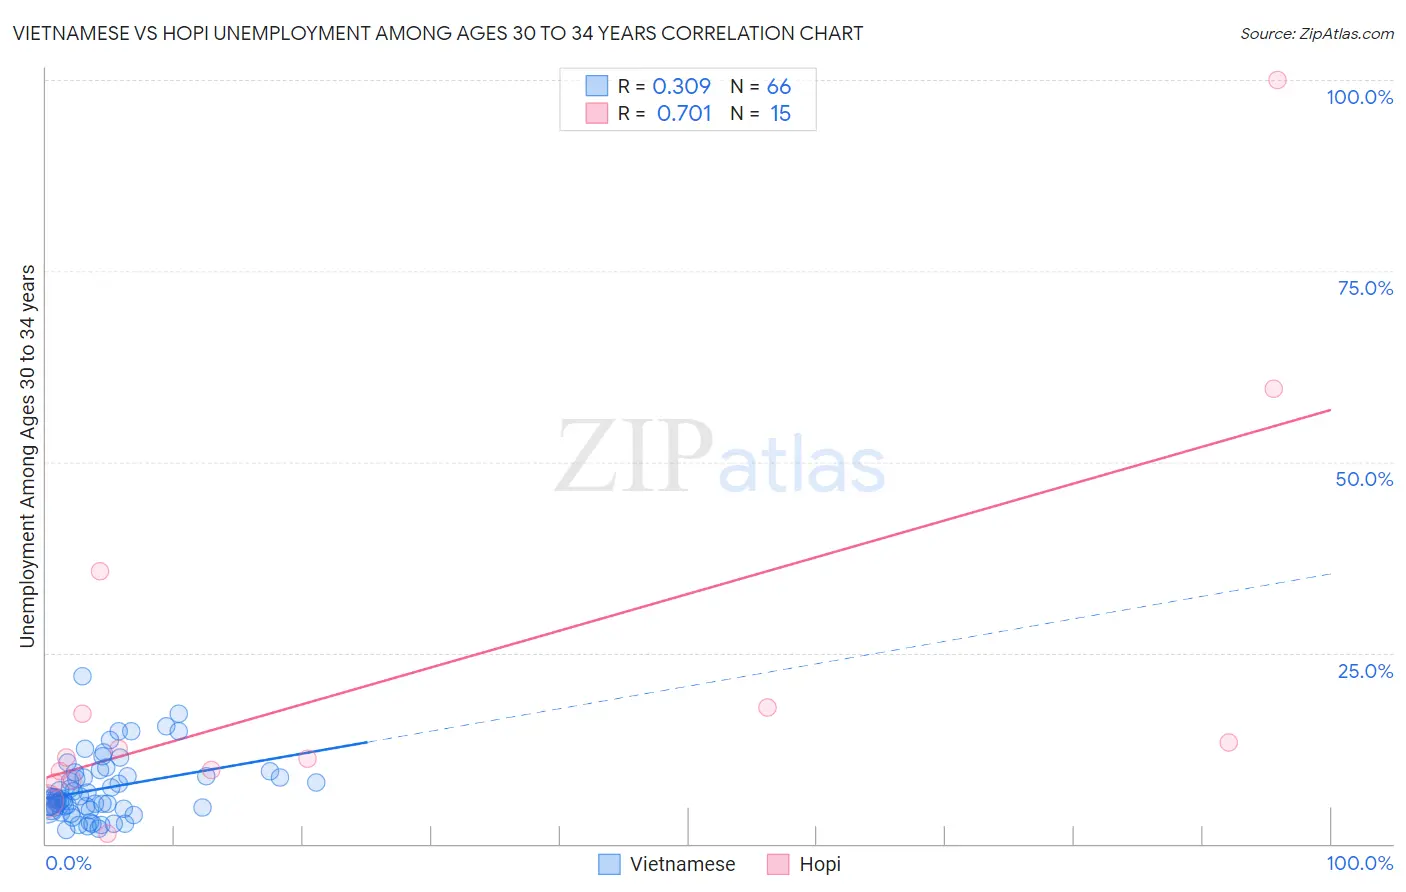
Vietnamese vs Hopi Unemployment Among Ages 30 to 34 years Correlation Chart
The statistical analysis conducted on geographies consisting of 167,594,884 people shows a mild positive correlation between the proportion of Vietnamese and unemployment rate among population between the ages 30 and 34 in the United States with a correlation coefficient (R) of 0.309 and weighted average of 6.5%. Similarly, the statistical analysis conducted on geographies consisting of 73,932,121 people shows a strong positive correlation between the proportion of Hopi and unemployment rate among population between the ages 30 and 34 in the United States with a correlation coefficient (R) of 0.701 and weighted average of 11.9%, a difference of 83.8%.
Unemployment Among Ages 30 to 34 years Correlation Summary
| Measurement | Vietnamese | Hopi |
| Minimum | 1.8% | 1.3% |
| Maximum | 22.0% | 100.0% |
| Range | 20.2% | 98.7% |
| Mean | 7.2% | 21.4% |
| Median | 5.9% | 11.3% |
| Interquartile 25% (IQ1) | 4.7% | 8.4% |
| Interquartile 75% (IQ3) | 8.9% | 17.8% |
| Interquartile Range (IQR) | 4.2% | 9.4% |
| Standard Deviation (Sample) | 4.1% | 26.1% |
| Standard Deviation (Population) | 4.0% | 25.2% |
Similar Demographics by Unemployment Among Ages 30 to 34 years
Demographics Similar to Vietnamese by Unemployment Among Ages 30 to 34 years
In terms of unemployment among ages 30 to 34 years, the demographic groups most similar to Vietnamese are West Indian (6.5%, a difference of 0.070%), Jamaican (6.5%, a difference of 0.27%), Barbadian (6.5%, a difference of 0.50%), Immigrants from Trinidad and Tobago (6.5%, a difference of 0.56%), and Trinidadian and Tobagonian (6.5%, a difference of 0.74%).
| Demographics | Rating | Rank | Unemployment Among Ages 30 to 34 years |
| Choctaw | 0.0 /100 | #285 | Tragic 6.4% |
| Central American Indians | 0.0 /100 | #286 | Tragic 6.4% |
| Immigrants | West Indies | 0.0 /100 | #287 | Tragic 6.4% |
| Senegalese | 0.0 /100 | #288 | Tragic 6.4% |
| Menominee | 0.0 /100 | #289 | Tragic 6.4% |
| Immigrants | Trinidad and Tobago | 0.0 /100 | #290 | Tragic 6.5% |
| Jamaicans | 0.0 /100 | #291 | Tragic 6.5% |
| Vietnamese | 0.0 /100 | #292 | Tragic 6.5% |
| West Indians | 0.0 /100 | #293 | Tragic 6.5% |
| Barbadians | 0.0 /100 | #294 | Tragic 6.5% |
| Trinidadians and Tobagonians | 0.0 /100 | #295 | Tragic 6.5% |
| Immigrants | Jamaica | 0.0 /100 | #296 | Tragic 6.5% |
| Creek | 0.0 /100 | #297 | Tragic 6.6% |
| Immigrants | Barbados | 0.0 /100 | #298 | Tragic 6.6% |
| Dutch West Indians | 0.0 /100 | #299 | Tragic 6.6% |
Demographics Similar to Hopi by Unemployment Among Ages 30 to 34 years
In terms of unemployment among ages 30 to 34 years, the demographic groups most similar to Hopi are Arapaho (12.8%, a difference of 7.4%), Inupiat (10.8%, a difference of 10.3%), Yuman (10.6%, a difference of 12.7%), Navajo (10.6%, a difference of 13.1%), and Tsimshian (13.8%, a difference of 15.3%).
| Demographics | Rating | Rank | Unemployment Among Ages 30 to 34 years |
| Pueblo | 0.0 /100 | #333 | Tragic 8.3% |
| Alaska Natives | 0.0 /100 | #334 | Tragic 8.5% |
| Puerto Ricans | 0.0 /100 | #335 | Tragic 8.9% |
| Colville | 0.0 /100 | #336 | Tragic 9.0% |
| Pima | 0.0 /100 | #337 | Tragic 9.6% |
| Yakama | 0.0 /100 | #338 | Tragic 9.8% |
| Tohono O'odham | 0.0 /100 | #339 | Tragic 9.8% |
| Crow | 0.0 /100 | #340 | Tragic 10.3% |
| Navajo | 0.0 /100 | #341 | Tragic 10.6% |
| Yuman | 0.0 /100 | #342 | Tragic 10.6% |
| Inupiat | 0.0 /100 | #343 | Tragic 10.8% |
| Hopi | 0.0 /100 | #344 | Tragic 11.9% |
| Arapaho | 0.0 /100 | #345 | Tragic 12.8% |
| Tsimshian | 0.0 /100 | #346 | Tragic 13.8% |
| Yup'ik | 0.0 /100 | #347 | Tragic 18.5% |