Venezuelan vs South American Unemployment Among Ages 55 to 59 years
COMPARE
Venezuelan
South American
Unemployment Among Ages 55 to 59 years
Unemployment Among Ages 55 to 59 years Comparison
Venezuelans
South Americans
4.2%
UNEMPLOYMENT AMONG AGES 55 TO 59 YEARS
100.0/ 100
METRIC RATING
4th/ 347
METRIC RANK
4.8%
UNEMPLOYMENT AMONG AGES 55 TO 59 YEARS
44.0/ 100
METRIC RATING
180th/ 347
METRIC RANK
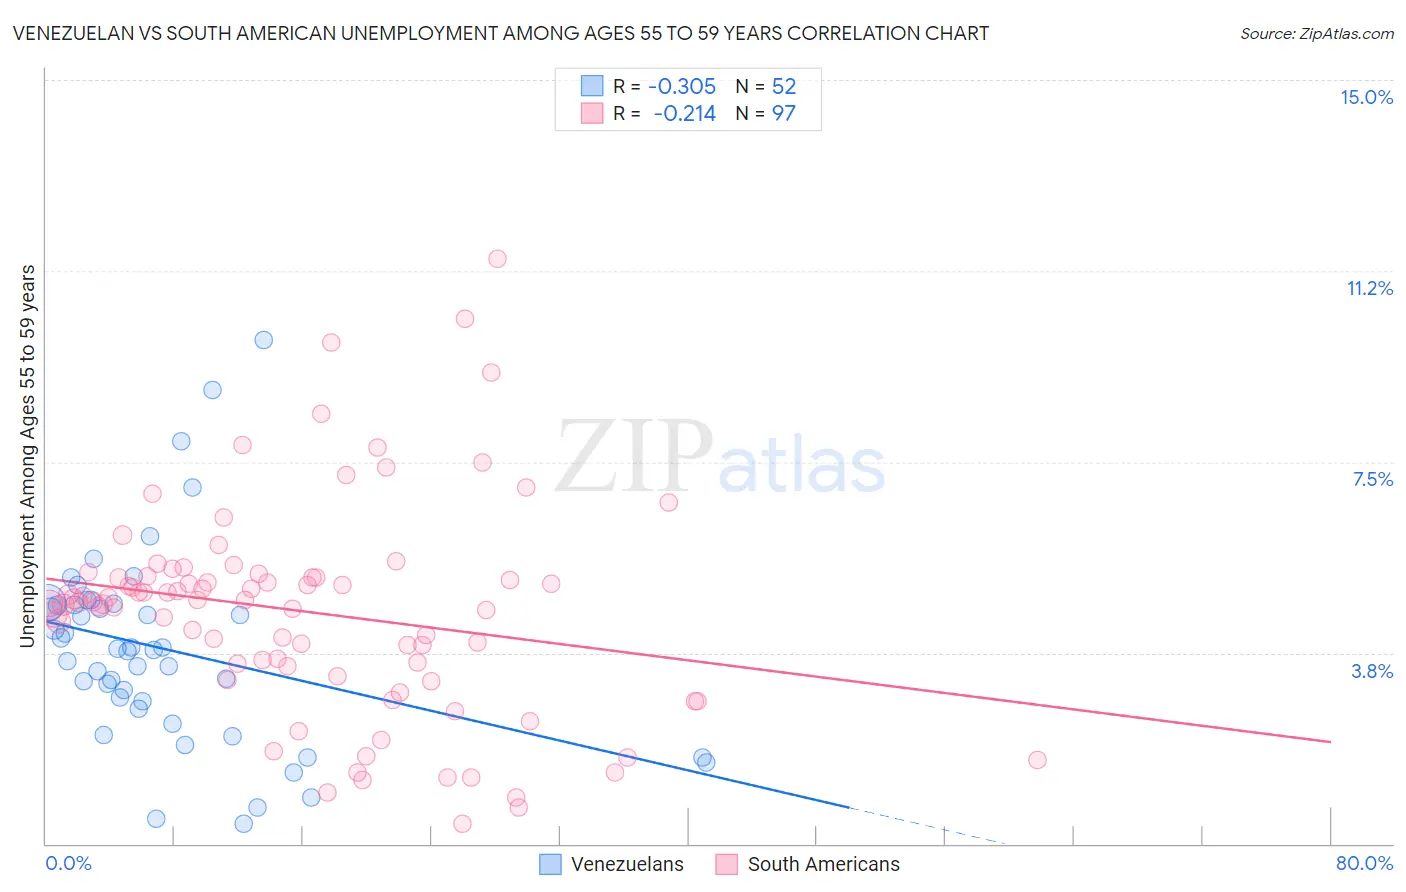
Venezuelan vs South American Unemployment Among Ages 55 to 59 years Correlation Chart
The statistical analysis conducted on geographies consisting of 290,130,641 people shows a mild negative correlation between the proportion of Venezuelans and unemployment rate among population between the ages 55 and 59 in the United States with a correlation coefficient (R) of -0.305 and weighted average of 4.2%. Similarly, the statistical analysis conducted on geographies consisting of 447,278,778 people shows a weak negative correlation between the proportion of South Americans and unemployment rate among population between the ages 55 and 59 in the United States with a correlation coefficient (R) of -0.214 and weighted average of 4.8%, a difference of 16.1%.
Unemployment Among Ages 55 to 59 years Correlation Summary
| Measurement | Venezuelan | South American |
| Minimum | 0.40% | 0.40% |
| Maximum | 9.9% | 11.5% |
| Range | 9.5% | 11.1% |
| Mean | 3.8% | 4.6% |
| Median | 3.8% | 4.8% |
| Interquartile 25% (IQ1) | 2.7% | 3.4% |
| Interquartile 75% (IQ3) | 4.7% | 5.2% |
| Interquartile Range (IQR) | 2.0% | 1.9% |
| Standard Deviation (Sample) | 1.9% | 2.1% |
| Standard Deviation (Population) | 1.9% | 2.1% |
Similar Demographics by Unemployment Among Ages 55 to 59 years
Demographics Similar to Venezuelans by Unemployment Among Ages 55 to 59 years
In terms of unemployment among ages 55 to 59 years, the demographic groups most similar to Venezuelans are Immigrants from Bolivia (4.2%, a difference of 0.54%), Norwegian (4.2%, a difference of 1.1%), Zimbabwean (4.2%, a difference of 1.7%), Bolivian (4.2%, a difference of 1.8%), and Immigrants from Venezuela (4.1%, a difference of 1.9%).
| Demographics | Rating | Rank | Unemployment Among Ages 55 to 59 years |
| Fijians | 100.0 /100 | #1 | Exceptional 4.1% |
| Immigrants | Cuba | 100.0 /100 | #2 | Exceptional 4.1% |
| Immigrants | Venezuela | 100.0 /100 | #3 | Exceptional 4.1% |
| Venezuelans | 100.0 /100 | #4 | Exceptional 4.2% |
| Immigrants | Bolivia | 100.0 /100 | #5 | Exceptional 4.2% |
| Norwegians | 100.0 /100 | #6 | Exceptional 4.2% |
| Zimbabweans | 100.0 /100 | #7 | Exceptional 4.2% |
| Bolivians | 100.0 /100 | #8 | Exceptional 4.2% |
| Cubans | 100.0 /100 | #9 | Exceptional 4.2% |
| Tongans | 100.0 /100 | #10 | Exceptional 4.3% |
| Immigrants | Congo | 100.0 /100 | #11 | Exceptional 4.3% |
| Danes | 100.0 /100 | #12 | Exceptional 4.3% |
| Indonesians | 100.0 /100 | #13 | Exceptional 4.3% |
| Immigrants | India | 100.0 /100 | #14 | Exceptional 4.3% |
| Bulgarians | 100.0 /100 | #15 | Exceptional 4.3% |
Demographics Similar to South Americans by Unemployment Among Ages 55 to 59 years
In terms of unemployment among ages 55 to 59 years, the demographic groups most similar to South Americans are Hungarian (4.8%, a difference of 0.010%), Arab (4.8%, a difference of 0.030%), Immigrants from Sri Lanka (4.8%, a difference of 0.12%), Samoan (4.8%, a difference of 0.13%), and Immigrants from Hungary (4.8%, a difference of 0.15%).
| Demographics | Rating | Rank | Unemployment Among Ages 55 to 59 years |
| Immigrants | Eastern Europe | 52.2 /100 | #173 | Average 4.8% |
| Immigrants | Croatia | 50.0 /100 | #174 | Average 4.8% |
| Australians | 48.6 /100 | #175 | Average 4.8% |
| Samoans | 47.1 /100 | #176 | Average 4.8% |
| Immigrants | Sri Lanka | 46.8 /100 | #177 | Average 4.8% |
| Arabs | 44.7 /100 | #178 | Average 4.8% |
| Hungarians | 44.3 /100 | #179 | Average 4.8% |
| South Americans | 44.0 /100 | #180 | Average 4.8% |
| Immigrants | Hungary | 40.4 /100 | #181 | Average 4.8% |
| Immigrants | Europe | 40.4 /100 | #182 | Average 4.8% |
| Immigrants | Peru | 38.6 /100 | #183 | Fair 4.8% |
| Immigrants | Czechoslovakia | 38.0 /100 | #184 | Fair 4.8% |
| Peruvians | 37.0 /100 | #185 | Fair 4.8% |
| Osage | 37.0 /100 | #186 | Fair 4.8% |
| Immigrants | Morocco | 36.5 /100 | #187 | Fair 4.8% |