Venezuelan vs Palestinian Unemployment Among Ages 16 to 19 years
COMPARE
Venezuelan
Palestinian
Unemployment Among Ages 16 to 19 years
Unemployment Among Ages 16 to 19 years Comparison
Venezuelans
Palestinians
17.1%
UNEMPLOYMENT AMONG AGES 16 TO 19 YEARS
91.8/ 100
METRIC RATING
118th/ 347
METRIC RANK
17.0%
UNEMPLOYMENT AMONG AGES 16 TO 19 YEARS
94.6/ 100
METRIC RATING
103rd/ 347
METRIC RANK
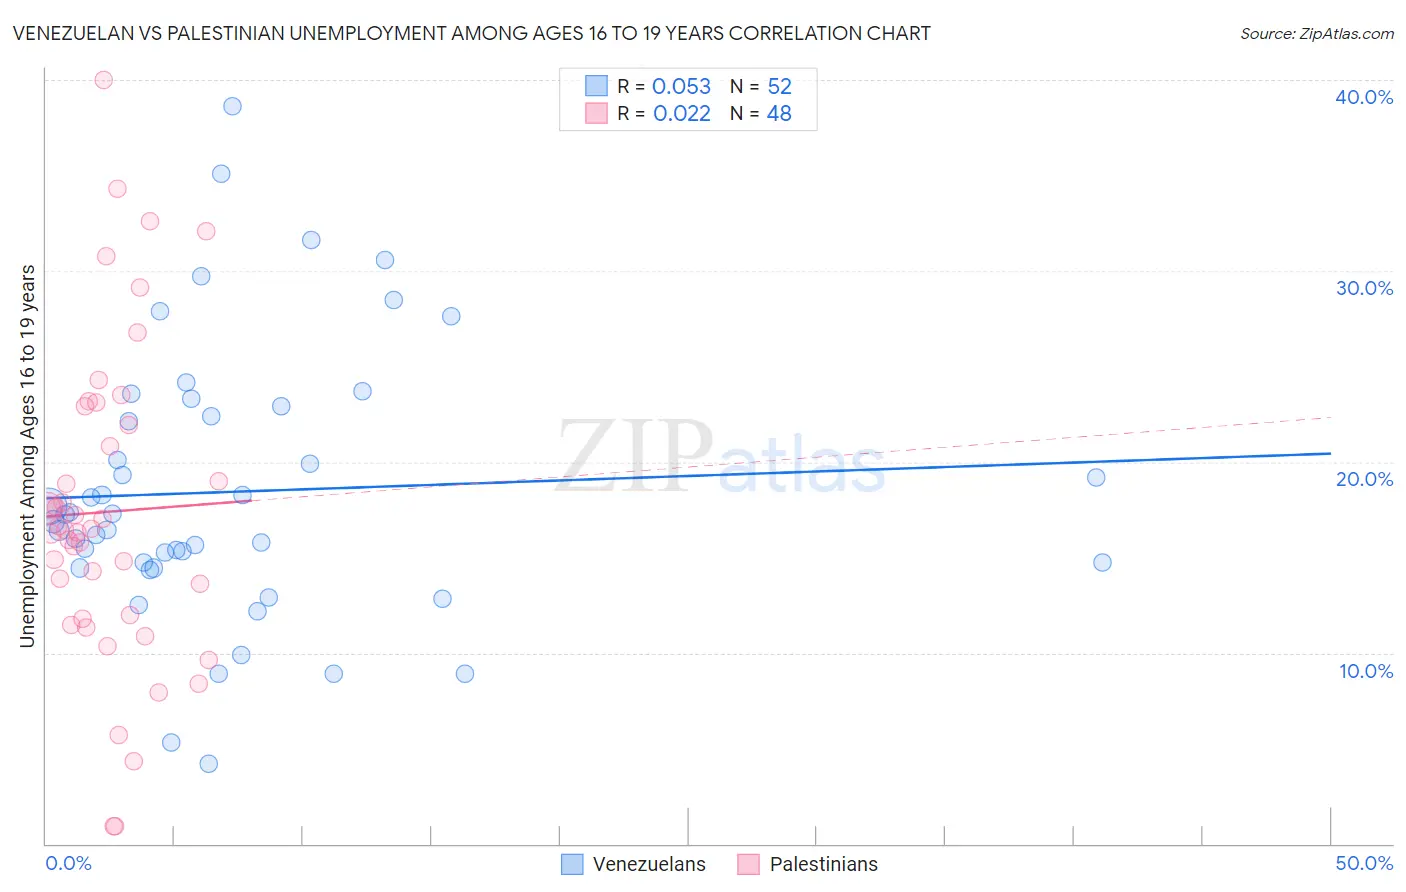
Venezuelan vs Palestinian Unemployment Among Ages 16 to 19 years Correlation Chart
The statistical analysis conducted on geographies consisting of 294,685,523 people shows a slight positive correlation between the proportion of Venezuelans and unemployment rate among population between the ages 16 and 19 in the United States with a correlation coefficient (R) of 0.053 and weighted average of 17.1%. Similarly, the statistical analysis conducted on geographies consisting of 210,532,956 people shows no correlation between the proportion of Palestinians and unemployment rate among population between the ages 16 and 19 in the United States with a correlation coefficient (R) of 0.022 and weighted average of 17.0%, a difference of 0.53%.
Unemployment Among Ages 16 to 19 years Correlation Summary
| Measurement | Venezuelan | Palestinian |
| Minimum | 4.2% | 0.90% |
| Maximum | 38.6% | 40.0% |
| Range | 34.4% | 39.1% |
| Mean | 18.4% | 17.4% |
| Median | 17.1% | 16.5% |
| Interquartile 25% (IQ1) | 14.6% | 11.9% |
| Interquartile 75% (IQ3) | 22.6% | 22.4% |
| Interquartile Range (IQR) | 8.1% | 10.5% |
| Standard Deviation (Sample) | 7.1% | 8.3% |
| Standard Deviation (Population) | 7.1% | 8.2% |
Demographics Similar to Venezuelans and Palestinians by Unemployment Among Ages 16 to 19 years
In terms of unemployment among ages 16 to 19 years, the demographic groups most similar to Venezuelans are Immigrants from Sri Lanka (17.1%, a difference of 0.020%), Hungarian (17.1%, a difference of 0.030%), Immigrants from Korea (17.1%, a difference of 0.060%), Brazilian (17.1%, a difference of 0.070%), and Immigrants from Middle Africa (17.1%, a difference of 0.15%). Similarly, the demographic groups most similar to Palestinians are Italian (17.0%, a difference of 0.0%), Immigrants from Pakistan (17.0%, a difference of 0.010%), Immigrants from Saudi Arabia (17.0%, a difference of 0.030%), Immigrants from Thailand (17.0%, a difference of 0.040%), and Immigrants from Bulgaria (17.0%, a difference of 0.050%).
| Demographics | Rating | Rank | Unemployment Among Ages 16 to 19 years |
| Immigrants | Thailand | 94.7 /100 | #100 | Exceptional 17.0% |
| Immigrants | Saudi Arabia | 94.7 /100 | #101 | Exceptional 17.0% |
| Immigrants | Pakistan | 94.6 /100 | #102 | Exceptional 17.0% |
| Palestinians | 94.6 /100 | #103 | Exceptional 17.0% |
| Italians | 94.5 /100 | #104 | Exceptional 17.0% |
| Immigrants | Bulgaria | 94.3 /100 | #105 | Exceptional 17.0% |
| Estonians | 94.3 /100 | #106 | Exceptional 17.0% |
| Immigrants | Brazil | 94.2 /100 | #107 | Exceptional 17.0% |
| Malaysians | 94.2 /100 | #108 | Exceptional 17.0% |
| Iranians | 94.1 /100 | #109 | Exceptional 17.0% |
| Immigrants | Netherlands | 93.9 /100 | #110 | Exceptional 17.0% |
| Immigrants | Asia | 93.9 /100 | #111 | Exceptional 17.0% |
| Immigrants | Iraq | 93.7 /100 | #112 | Exceptional 17.0% |
| Icelanders | 93.4 /100 | #113 | Exceptional 17.0% |
| Immigrants | Poland | 93.1 /100 | #114 | Exceptional 17.0% |
| Brazilians | 92.3 /100 | #115 | Exceptional 17.1% |
| Immigrants | Korea | 92.2 /100 | #116 | Exceptional 17.1% |
| Immigrants | Sri Lanka | 92.0 /100 | #117 | Exceptional 17.1% |
| Venezuelans | 91.8 /100 | #118 | Exceptional 17.1% |
| Hungarians | 91.6 /100 | #119 | Exceptional 17.1% |
| Immigrants | Middle Africa | 90.9 /100 | #120 | Exceptional 17.1% |