Ute vs Colombian Unemployment Among Ages 60 to 64 years
COMPARE
Ute
Colombian
Unemployment Among Ages 60 to 64 years
Unemployment Among Ages 60 to 64 years Comparison
Ute
Colombians
4.9%
UNEMPLOYMENT AMONG AGES 60 TO 64 YEARS
37.4/ 100
METRIC RATING
185th/ 347
METRIC RANK
4.9%
UNEMPLOYMENT AMONG AGES 60 TO 64 YEARS
22.7/ 100
METRIC RATING
201st/ 347
METRIC RANK
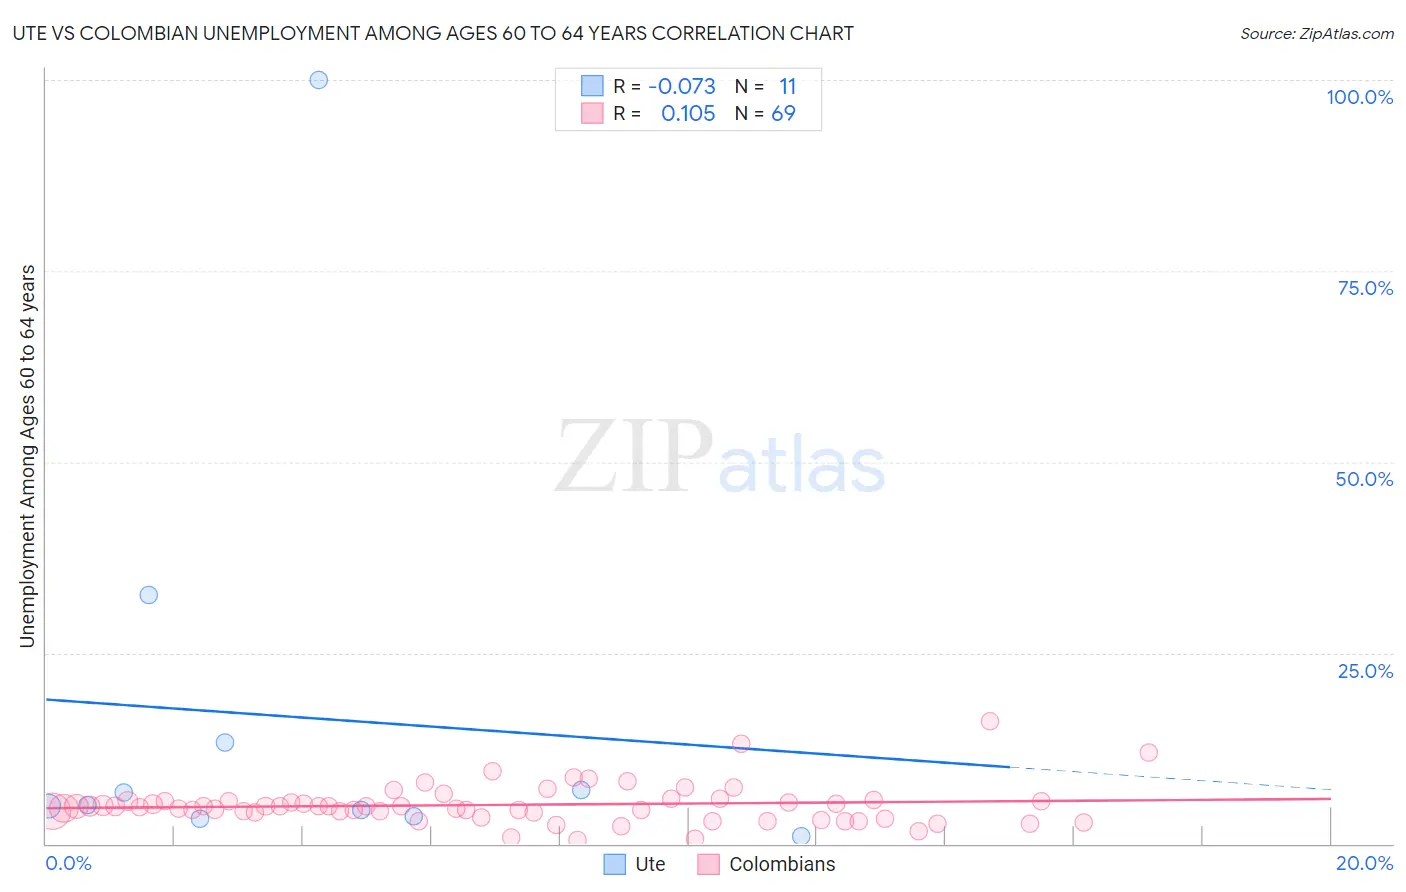
Ute vs Colombian Unemployment Among Ages 60 to 64 years Correlation Chart
The statistical analysis conducted on geographies consisting of 53,806,668 people shows a slight negative correlation between the proportion of Ute and unemployment rate among population between the ages 60 and 64 in the United States with a correlation coefficient (R) of -0.073 and weighted average of 4.9%. Similarly, the statistical analysis conducted on geographies consisting of 380,515,532 people shows a poor positive correlation between the proportion of Colombians and unemployment rate among population between the ages 60 and 64 in the United States with a correlation coefficient (R) of 0.105 and weighted average of 4.9%, a difference of 0.63%.
Unemployment Among Ages 60 to 64 years Correlation Summary
| Measurement | Ute | Colombian |
| Minimum | 1.0% | 0.50% |
| Maximum | 100.0% | 16.1% |
| Range | 99.0% | 15.6% |
| Mean | 16.5% | 5.1% |
| Median | 5.1% | 4.9% |
| Interquartile 25% (IQ1) | 3.6% | 3.7% |
| Interquartile 75% (IQ3) | 13.3% | 5.6% |
| Interquartile Range (IQR) | 9.7% | 1.9% |
| Standard Deviation (Sample) | 29.0% | 2.6% |
| Standard Deviation (Population) | 27.7% | 2.6% |
Demographics Similar to Ute and Colombians by Unemployment Among Ages 60 to 64 years
In terms of unemployment among ages 60 to 64 years, the demographic groups most similar to Ute are Immigrants from Ukraine (4.9%, a difference of 0.010%), Subsaharan African (4.9%, a difference of 0.050%), Spaniard (4.9%, a difference of 0.060%), South American Indian (4.9%, a difference of 0.24%), and Nicaraguan (4.9%, a difference of 0.28%). Similarly, the demographic groups most similar to Colombians are Immigrants from Czechoslovakia (4.9%, a difference of 0.040%), Guamanian/Chamorro (4.9%, a difference of 0.050%), Immigrants from Vietnam (4.9%, a difference of 0.050%), Immigrants from Western Africa (4.9%, a difference of 0.10%), and Immigrants from Eastern Europe (4.9%, a difference of 0.12%).
| Demographics | Rating | Rank | Unemployment Among Ages 60 to 64 years |
| Sub-Saharan Africans | 38.9 /100 | #183 | Fair 4.9% |
| Immigrants | Ukraine | 37.6 /100 | #184 | Fair 4.9% |
| Ute | 37.4 /100 | #185 | Fair 4.9% |
| Spaniards | 35.8 /100 | #186 | Fair 4.9% |
| South American Indians | 31.2 /100 | #187 | Fair 4.9% |
| Nicaraguans | 30.4 /100 | #188 | Fair 4.9% |
| Immigrants | Nicaragua | 29.8 /100 | #189 | Fair 4.9% |
| Immigrants | Europe | 29.8 /100 | #190 | Fair 4.9% |
| Immigrants | Nigeria | 29.6 /100 | #191 | Fair 4.9% |
| Menominee | 28.8 /100 | #192 | Fair 4.9% |
| Houma | 28.3 /100 | #193 | Fair 4.9% |
| Immigrants | Colombia | 26.8 /100 | #194 | Fair 4.9% |
| Immigrants | Austria | 26.6 /100 | #195 | Fair 4.9% |
| Immigrants | Asia | 25.7 /100 | #196 | Fair 4.9% |
| Immigrants | Eastern Europe | 25.2 /100 | #197 | Fair 4.9% |
| Guamanians/Chamorros | 23.7 /100 | #198 | Fair 4.9% |
| Immigrants | Vietnam | 23.7 /100 | #199 | Fair 4.9% |
| Immigrants | Czechoslovakia | 23.5 /100 | #200 | Fair 4.9% |
| Colombians | 22.7 /100 | #201 | Fair 4.9% |
| Immigrants | Western Africa | 20.6 /100 | #202 | Fair 4.9% |
| Uruguayans | 19.9 /100 | #203 | Poor 4.9% |