U.S. Virgin Islander vs Immigrants from Czechoslovakia Unemployment Among Seniors over 65 years
COMPARE
U.S. Virgin Islander
Immigrants from Czechoslovakia
Unemployment Among Seniors over 65 years
Unemployment Among Seniors over 65 years Comparison
U.S. Virgin Islanders
Immigrants from Czechoslovakia
5.5%
UNEMPLOYMENT AMONG SENIORS OVER 65 YEARS
0.0/ 100
METRIC RATING
288th/ 347
METRIC RANK
5.1%
UNEMPLOYMENT AMONG SENIORS OVER 65 YEARS
74.5/ 100
METRIC RATING
153rd/ 347
METRIC RANK
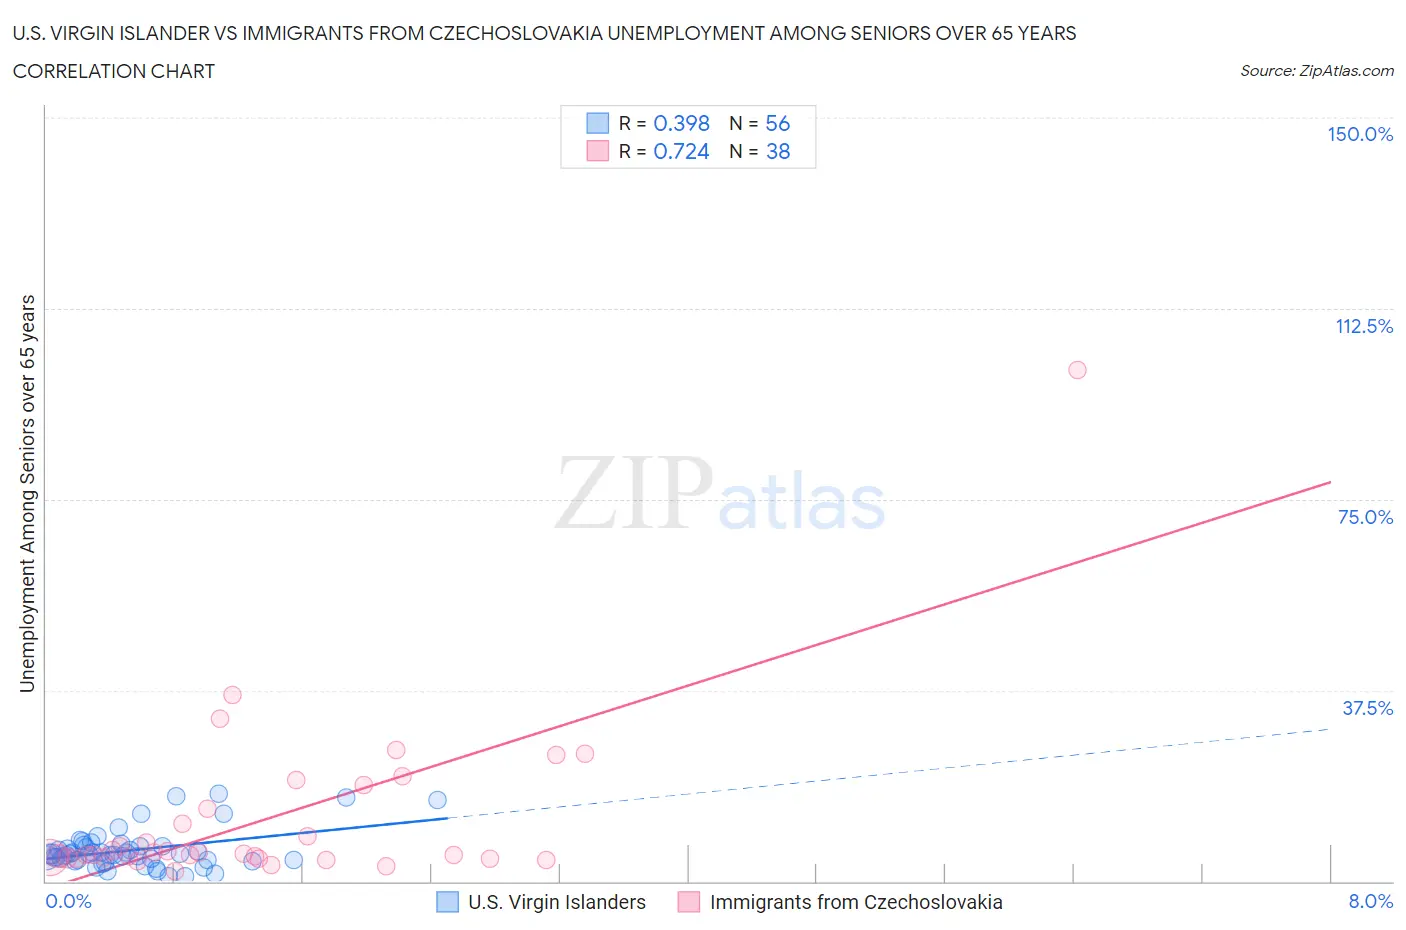
U.S. Virgin Islander vs Immigrants from Czechoslovakia Unemployment Among Seniors over 65 years Correlation Chart
The statistical analysis conducted on geographies consisting of 85,139,014 people shows a mild positive correlation between the proportion of U.S. Virgin Islanders and unemployment rate amomg seniors over the age of 65 in the United States with a correlation coefficient (R) of 0.398 and weighted average of 5.5%. Similarly, the statistical analysis conducted on geographies consisting of 186,469,474 people shows a strong positive correlation between the proportion of Immigrants from Czechoslovakia and unemployment rate amomg seniors over the age of 65 in the United States with a correlation coefficient (R) of 0.724 and weighted average of 5.1%, a difference of 7.8%.
Unemployment Among Seniors over 65 years Correlation Summary
| Measurement | U.S. Virgin Islander | Immigrants from Czechoslovakia |
| Minimum | 1.1% | 1.9% |
| Maximum | 17.1% | 100.4% |
| Range | 16.0% | 98.5% |
| Mean | 6.1% | 12.2% |
| Median | 5.4% | 5.3% |
| Interquartile 25% (IQ1) | 4.1% | 4.6% |
| Interquartile 75% (IQ3) | 6.8% | 14.3% |
| Interquartile Range (IQR) | 2.7% | 9.8% |
| Standard Deviation (Sample) | 3.8% | 17.2% |
| Standard Deviation (Population) | 3.8% | 16.9% |
Similar Demographics by Unemployment Among Seniors over 65 years
Demographics Similar to U.S. Virgin Islanders by Unemployment Among Seniors over 65 years
In terms of unemployment among seniors over 65 years, the demographic groups most similar to U.S. Virgin Islanders are Venezuelan (5.5%, a difference of 0.0%), Immigrants from Barbados (5.5%, a difference of 0.030%), Immigrants from Cabo Verde (5.5%, a difference of 0.030%), Central American (5.5%, a difference of 0.060%), and Immigrants from Liberia (5.5%, a difference of 0.11%).
| Demographics | Rating | Rank | Unemployment Among Seniors over 65 years |
| Immigrants | Norway | 0.0 /100 | #281 | Tragic 5.5% |
| Immigrants | Belize | 0.0 /100 | #282 | Tragic 5.5% |
| Immigrants | Haiti | 0.0 /100 | #283 | Tragic 5.5% |
| Immigrants | Liberia | 0.0 /100 | #284 | Tragic 5.5% |
| Central Americans | 0.0 /100 | #285 | Tragic 5.5% |
| Immigrants | Barbados | 0.0 /100 | #286 | Tragic 5.5% |
| Venezuelans | 0.0 /100 | #287 | Tragic 5.5% |
| U.S. Virgin Islanders | 0.0 /100 | #288 | Tragic 5.5% |
| Immigrants | Cabo Verde | 0.0 /100 | #289 | Tragic 5.5% |
| Jamaicans | 0.0 /100 | #290 | Tragic 5.5% |
| Blacks/African Americans | 0.0 /100 | #291 | Tragic 5.5% |
| Belizeans | 0.0 /100 | #292 | Tragic 5.5% |
| Immigrants | Venezuela | 0.0 /100 | #293 | Tragic 5.5% |
| Armenians | 0.0 /100 | #294 | Tragic 5.5% |
| Cheyenne | 0.0 /100 | #295 | Tragic 5.5% |
Demographics Similar to Immigrants from Czechoslovakia by Unemployment Among Seniors over 65 years
In terms of unemployment among seniors over 65 years, the demographic groups most similar to Immigrants from Czechoslovakia are Canadian (5.1%, a difference of 0.010%), Immigrants from Hong Kong (5.1%, a difference of 0.020%), Pakistani (5.1%, a difference of 0.040%), Immigrants from Asia (5.1%, a difference of 0.050%), and Basque (5.1%, a difference of 0.070%).
| Demographics | Rating | Rank | Unemployment Among Seniors over 65 years |
| Immigrants | Russia | 78.5 /100 | #146 | Good 5.1% |
| Slovaks | 77.9 /100 | #147 | Good 5.1% |
| Greeks | 77.0 /100 | #148 | Good 5.1% |
| Immigrants | Afghanistan | 76.8 /100 | #149 | Good 5.1% |
| Immigrants | Asia | 75.6 /100 | #150 | Good 5.1% |
| Pakistanis | 75.5 /100 | #151 | Good 5.1% |
| Canadians | 74.7 /100 | #152 | Good 5.1% |
| Immigrants | Czechoslovakia | 74.5 /100 | #153 | Good 5.1% |
| Immigrants | Hong Kong | 74.0 /100 | #154 | Good 5.1% |
| Basques | 72.9 /100 | #155 | Good 5.1% |
| Immigrants | Romania | 72.4 /100 | #156 | Good 5.1% |
| Immigrants | Northern Europe | 69.8 /100 | #157 | Good 5.1% |
| Immigrants | Belarus | 69.0 /100 | #158 | Good 5.1% |
| Immigrants | France | 68.6 /100 | #159 | Good 5.1% |
| French | 68.1 /100 | #160 | Good 5.1% |