Uruguayan vs Immigrants from Turkey Unemployment Among Seniors over 65 years
COMPARE
Uruguayan
Immigrants from Turkey
Unemployment Among Seniors over 65 years
Unemployment Among Seniors over 65 years Comparison
Uruguayans
Immigrants from Turkey
5.2%
UNEMPLOYMENT AMONG SENIORS OVER 65 YEARS
12.6/ 100
METRIC RATING
208th/ 347
METRIC RANK
5.0%
UNEMPLOYMENT AMONG SENIORS OVER 65 YEARS
94.3/ 100
METRIC RATING
106th/ 347
METRIC RANK
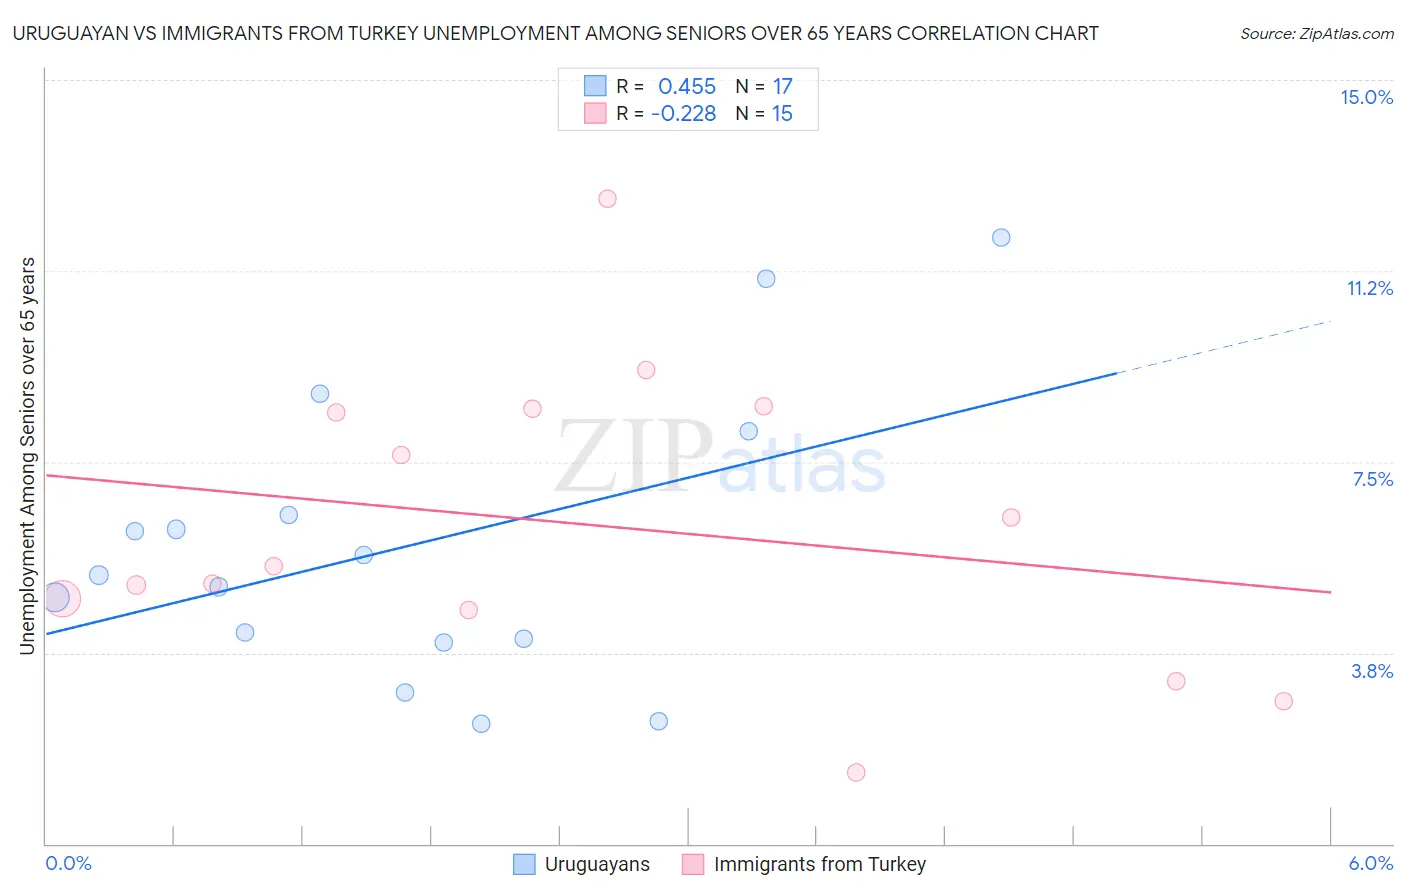
Uruguayan vs Immigrants from Turkey Unemployment Among Seniors over 65 years Correlation Chart
The statistical analysis conducted on geographies consisting of 139,566,940 people shows a moderate positive correlation between the proportion of Uruguayans and unemployment rate amomg seniors over the age of 65 in the United States with a correlation coefficient (R) of 0.455 and weighted average of 5.2%. Similarly, the statistical analysis conducted on geographies consisting of 212,028,802 people shows a weak negative correlation between the proportion of Immigrants from Turkey and unemployment rate amomg seniors over the age of 65 in the United States with a correlation coefficient (R) of -0.228 and weighted average of 5.0%, a difference of 3.9%.
Unemployment Among Seniors over 65 years Correlation Summary
| Measurement | Uruguayan | Immigrants from Turkey |
| Minimum | 2.4% | 1.4% |
| Maximum | 11.9% | 12.7% |
| Range | 9.5% | 11.3% |
| Mean | 5.8% | 6.3% |
| Median | 5.3% | 5.5% |
| Interquartile 25% (IQ1) | 4.0% | 4.6% |
| Interquartile 75% (IQ3) | 7.3% | 8.5% |
| Interquartile Range (IQR) | 3.3% | 3.9% |
| Standard Deviation (Sample) | 2.8% | 2.9% |
| Standard Deviation (Population) | 2.7% | 2.8% |
Similar Demographics by Unemployment Among Seniors over 65 years
Demographics Similar to Uruguayans by Unemployment Among Seniors over 65 years
In terms of unemployment among seniors over 65 years, the demographic groups most similar to Uruguayans are Immigrants from Philippines (5.2%, a difference of 0.040%), Alsatian (5.2%, a difference of 0.090%), German Russian (5.2%, a difference of 0.14%), Immigrants from Uzbekistan (5.2%, a difference of 0.14%), and African (5.2%, a difference of 0.17%).
| Demographics | Rating | Rank | Unemployment Among Seniors over 65 years |
| Laotians | 18.1 /100 | #201 | Poor 5.2% |
| Immigrants | Northern Africa | 17.7 /100 | #202 | Poor 5.2% |
| Sub-Saharan Africans | 17.1 /100 | #203 | Poor 5.2% |
| Immigrants | China | 16.9 /100 | #204 | Poor 5.2% |
| South American Indians | 15.3 /100 | #205 | Poor 5.2% |
| German Russians | 14.7 /100 | #206 | Poor 5.2% |
| Immigrants | Philippines | 13.2 /100 | #207 | Poor 5.2% |
| Uruguayans | 12.6 /100 | #208 | Poor 5.2% |
| Alsatians | 11.4 /100 | #209 | Poor 5.2% |
| Immigrants | Uzbekistan | 10.7 /100 | #210 | Poor 5.2% |
| Africans | 10.4 /100 | #211 | Poor 5.2% |
| Immigrants | Honduras | 10.2 /100 | #212 | Poor 5.2% |
| Immigrants | Uruguay | 9.3 /100 | #213 | Tragic 5.2% |
| Albanians | 9.1 /100 | #214 | Tragic 5.2% |
| Immigrants | Fiji | 8.6 /100 | #215 | Tragic 5.2% |
Demographics Similar to Immigrants from Turkey by Unemployment Among Seniors over 65 years
In terms of unemployment among seniors over 65 years, the demographic groups most similar to Immigrants from Turkey are Okinawan (5.0%, a difference of 0.060%), Immigrants from Scotland (5.0%, a difference of 0.11%), Immigrants from Lithuania (5.0%, a difference of 0.13%), Immigrants from Germany (5.0%, a difference of 0.16%), and Immigrants from Thailand (5.0%, a difference of 0.18%).
| Demographics | Rating | Rank | Unemployment Among Seniors over 65 years |
| South Africans | 96.5 /100 | #99 | Exceptional 5.0% |
| Romanians | 95.5 /100 | #100 | Exceptional 5.0% |
| Yugoslavians | 95.4 /100 | #101 | Exceptional 5.0% |
| Immigrants | Thailand | 95.4 /100 | #102 | Exceptional 5.0% |
| Immigrants | Lithuania | 95.1 /100 | #103 | Exceptional 5.0% |
| Immigrants | Scotland | 95.0 /100 | #104 | Exceptional 5.0% |
| Okinawans | 94.7 /100 | #105 | Exceptional 5.0% |
| Immigrants | Turkey | 94.3 /100 | #106 | Exceptional 5.0% |
| Immigrants | Germany | 93.2 /100 | #107 | Exceptional 5.0% |
| Immigrants | Vietnam | 92.9 /100 | #108 | Exceptional 5.0% |
| Immigrants | Malaysia | 92.7 /100 | #109 | Exceptional 5.0% |
| Immigrants | Saudi Arabia | 92.7 /100 | #110 | Exceptional 5.0% |
| Finns | 92.2 /100 | #111 | Exceptional 5.0% |
| Eastern Europeans | 92.0 /100 | #112 | Exceptional 5.0% |
| Seminole | 91.4 /100 | #113 | Exceptional 5.0% |