Uruguayan vs Immigrants from Chile Unemployment Among Ages 16 to 19 years
COMPARE
Uruguayan
Immigrants from Chile
Unemployment Among Ages 16 to 19 years
Unemployment Among Ages 16 to 19 years Comparison
Uruguayans
Immigrants from Chile
17.5%
UNEMPLOYMENT AMONG AGES 16 TO 19 YEARS
64.3/ 100
METRIC RATING
157th/ 347
METRIC RANK
18.1%
UNEMPLOYMENT AMONG AGES 16 TO 19 YEARS
7.5/ 100
METRIC RATING
225th/ 347
METRIC RANK
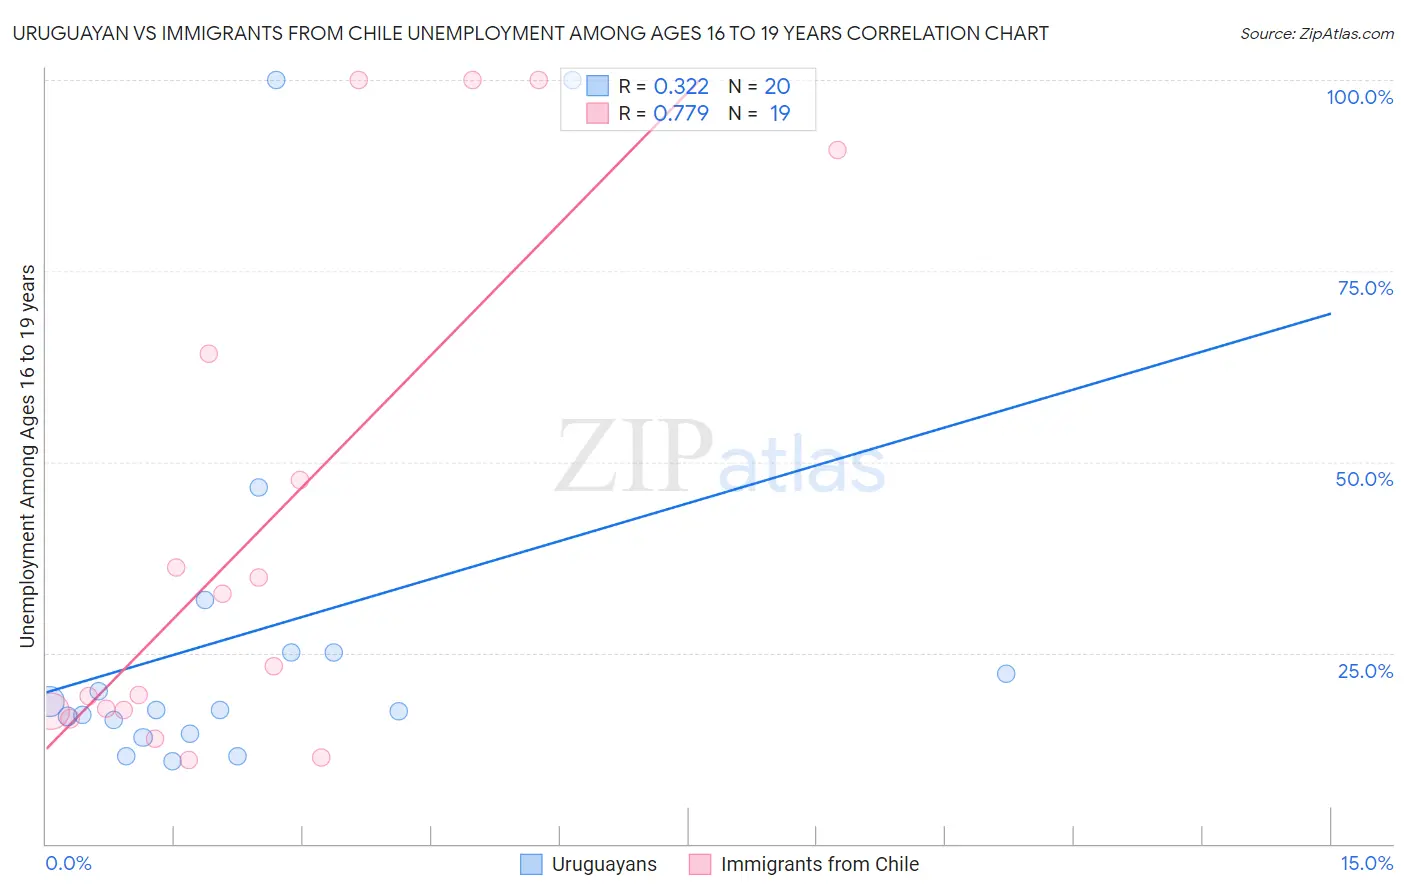
Uruguayan vs Immigrants from Chile Unemployment Among Ages 16 to 19 years Correlation Chart
The statistical analysis conducted on geographies consisting of 141,401,091 people shows a mild positive correlation between the proportion of Uruguayans and unemployment rate among population between the ages 16 and 19 in the United States with a correlation coefficient (R) of 0.322 and weighted average of 17.5%. Similarly, the statistical analysis conducted on geographies consisting of 212,816,088 people shows a strong positive correlation between the proportion of Immigrants from Chile and unemployment rate among population between the ages 16 and 19 in the United States with a correlation coefficient (R) of 0.779 and weighted average of 18.1%, a difference of 3.7%.
Unemployment Among Ages 16 to 19 years Correlation Summary
| Measurement | Uruguayan | Immigrants from Chile |
| Minimum | 10.8% | 11.0% |
| Maximum | 100.0% | 100.0% |
| Range | 89.2% | 89.0% |
| Mean | 27.7% | 40.7% |
| Median | 17.5% | 23.3% |
| Interquartile 25% (IQ1) | 15.3% | 17.3% |
| Interquartile 75% (IQ3) | 25.0% | 64.1% |
| Interquartile Range (IQR) | 9.7% | 46.9% |
| Standard Deviation (Sample) | 26.0% | 33.1% |
| Standard Deviation (Population) | 25.4% | 32.2% |
Similar Demographics by Unemployment Among Ages 16 to 19 years
Demographics Similar to Uruguayans by Unemployment Among Ages 16 to 19 years
In terms of unemployment among ages 16 to 19 years, the demographic groups most similar to Uruguayans are Immigrants from China (17.5%, a difference of 0.010%), Costa Rican (17.4%, a difference of 0.080%), Portuguese (17.4%, a difference of 0.16%), Korean (17.5%, a difference of 0.17%), and Ukrainian (17.5%, a difference of 0.19%).
| Demographics | Rating | Rank | Unemployment Among Ages 16 to 19 years |
| Immigrants | Northern Europe | 72.5 /100 | #150 | Good 17.4% |
| Immigrants | Hong Kong | 69.3 /100 | #151 | Good 17.4% |
| Immigrants | Northern Africa | 69.0 /100 | #152 | Good 17.4% |
| Immigrants | Afghanistan | 68.6 /100 | #153 | Good 17.4% |
| Afghans | 68.1 /100 | #154 | Good 17.4% |
| Portuguese | 67.3 /100 | #155 | Good 17.4% |
| Costa Ricans | 65.9 /100 | #156 | Good 17.4% |
| Uruguayans | 64.3 /100 | #157 | Good 17.5% |
| Immigrants | China | 64.1 /100 | #158 | Good 17.5% |
| Koreans | 61.0 /100 | #159 | Good 17.5% |
| Ukrainians | 60.5 /100 | #160 | Good 17.5% |
| Immigrants | Denmark | 60.3 /100 | #161 | Good 17.5% |
| Immigrants | Norway | 59.8 /100 | #162 | Average 17.5% |
| Egyptians | 59.7 /100 | #163 | Average 17.5% |
| Immigrants | Austria | 57.7 /100 | #164 | Average 17.5% |
Demographics Similar to Immigrants from Chile by Unemployment Among Ages 16 to 19 years
In terms of unemployment among ages 16 to 19 years, the demographic groups most similar to Immigrants from Chile are Immigrants from Belgium (18.1%, a difference of 0.040%), Immigrants from Liberia (18.1%, a difference of 0.060%), Immigrants from Greece (18.1%, a difference of 0.070%), Immigrants from Serbia (18.1%, a difference of 0.12%), and Albanian (18.2%, a difference of 0.32%).
| Demographics | Rating | Rank | Unemployment Among Ages 16 to 19 years |
| Immigrants | Argentina | 12.5 /100 | #218 | Poor 18.0% |
| Immigrants | Africa | 12.0 /100 | #219 | Poor 18.0% |
| Immigrants | Albania | 11.4 /100 | #220 | Poor 18.0% |
| Immigrants | Spain | 11.4 /100 | #221 | Poor 18.0% |
| Immigrants | Iran | 10.7 /100 | #222 | Poor 18.0% |
| Immigrants | Western Asia | 10.2 /100 | #223 | Poor 18.0% |
| Immigrants | Serbia | 8.3 /100 | #224 | Tragic 18.1% |
| Immigrants | Chile | 7.5 /100 | #225 | Tragic 18.1% |
| Immigrants | Belgium | 7.3 /100 | #226 | Tragic 18.1% |
| Immigrants | Liberia | 7.1 /100 | #227 | Tragic 18.1% |
| Immigrants | Greece | 7.1 /100 | #228 | Tragic 18.1% |
| Albanians | 5.8 /100 | #229 | Tragic 18.2% |
| Spanish Americans | 4.7 /100 | #230 | Tragic 18.2% |
| Nepalese | 4.2 /100 | #231 | Tragic 18.2% |
| Immigrants | Russia | 4.0 /100 | #232 | Tragic 18.2% |