Ukrainian vs Seminole Unemployment Among Seniors over 75 years
COMPARE
Ukrainian
Seminole
Unemployment Among Seniors over 75 years
Unemployment Among Seniors over 75 years Comparison
Ukrainians
Seminole
9.3%
UNEMPLOYMENT AMONG SENIORS OVER 75 YEARS
0.7/ 100
METRIC RATING
263rd/ 347
METRIC RANK
7.1%
UNEMPLOYMENT AMONG SENIORS OVER 75 YEARS
100.0/ 100
METRIC RATING
16th/ 347
METRIC RANK
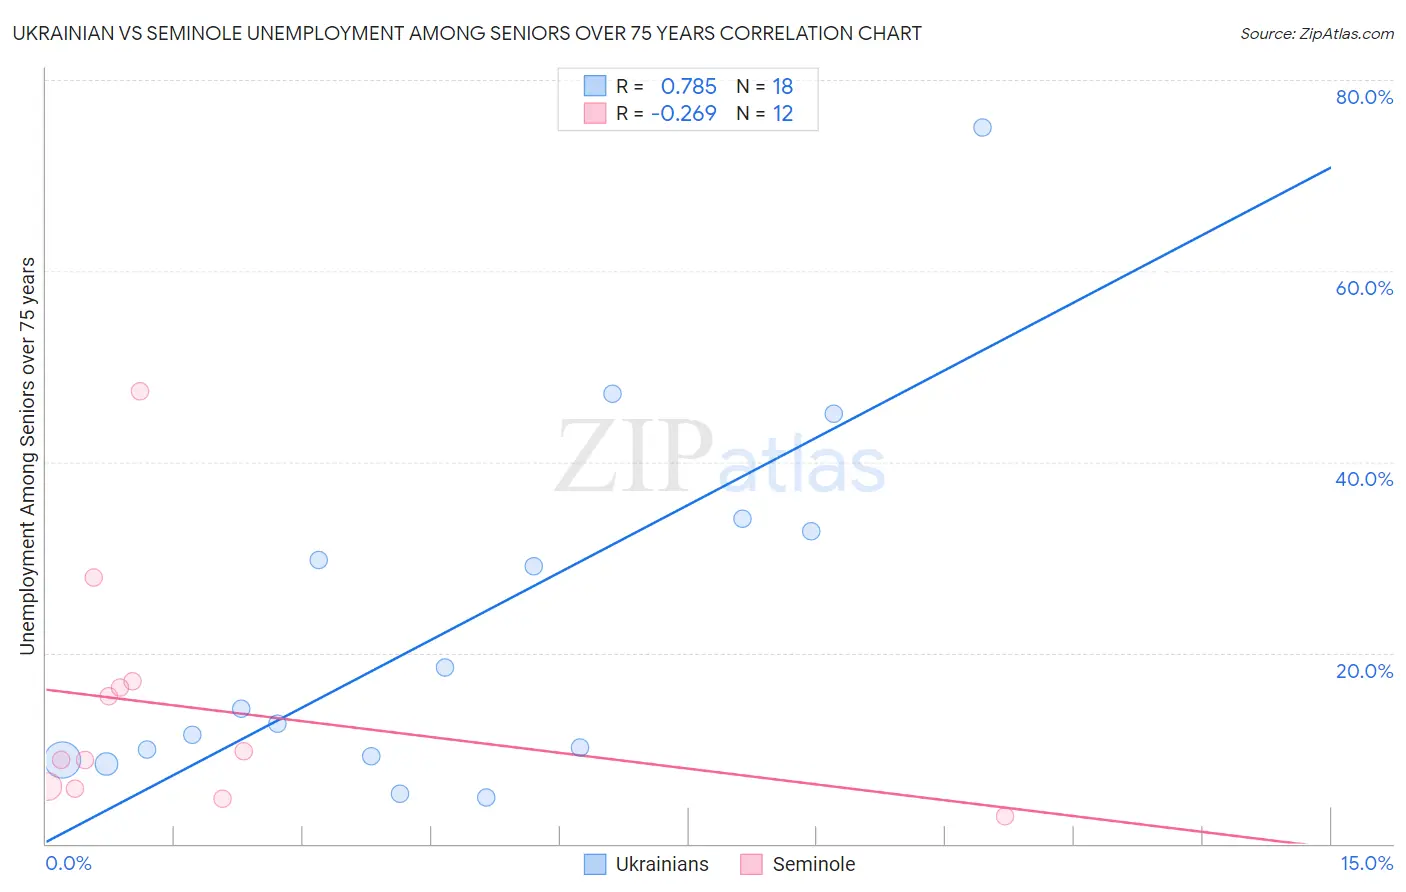
Ukrainian vs Seminole Unemployment Among Seniors over 75 years Correlation Chart
The statistical analysis conducted on geographies consisting of 214,568,076 people shows a strong positive correlation between the proportion of Ukrainians and unemployment rate among seniors over the age of 75 in the United States with a correlation coefficient (R) of 0.785 and weighted average of 9.3%. Similarly, the statistical analysis conducted on geographies consisting of 85,658,042 people shows a weak negative correlation between the proportion of Seminole and unemployment rate among seniors over the age of 75 in the United States with a correlation coefficient (R) of -0.269 and weighted average of 7.1%, a difference of 31.0%.
Unemployment Among Seniors over 75 years Correlation Summary
| Measurement | Ukrainian | Seminole |
| Minimum | 4.8% | 2.9% |
| Maximum | 75.0% | 47.4% |
| Range | 70.2% | 44.5% |
| Mean | 22.5% | 14.2% |
| Median | 13.3% | 9.3% |
| Interquartile 25% (IQ1) | 9.2% | 5.9% |
| Interquartile 75% (IQ3) | 32.7% | 16.7% |
| Interquartile Range (IQR) | 23.5% | 10.8% |
| Standard Deviation (Sample) | 18.8% | 12.6% |
| Standard Deviation (Population) | 18.3% | 12.0% |
Similar Demographics by Unemployment Among Seniors over 75 years
Demographics Similar to Ukrainians by Unemployment Among Seniors over 75 years
In terms of unemployment among seniors over 75 years, the demographic groups most similar to Ukrainians are Iroquois (9.3%, a difference of 0.010%), Austrian (9.3%, a difference of 0.12%), Palestinian (9.3%, a difference of 0.13%), Celtic (9.3%, a difference of 0.22%), and Black/African American (9.4%, a difference of 0.46%).
| Demographics | Rating | Rank | Unemployment Among Seniors over 75 years |
| Brazilians | 1.3 /100 | #256 | Tragic 9.3% |
| Hawaiians | 1.2 /100 | #257 | Tragic 9.3% |
| Immigrants | England | 1.0 /100 | #258 | Tragic 9.3% |
| Slovenes | 1.0 /100 | #259 | Tragic 9.3% |
| Immigrants | Cameroon | 1.0 /100 | #260 | Tragic 9.3% |
| Celtics | 0.8 /100 | #261 | Tragic 9.3% |
| Austrians | 0.7 /100 | #262 | Tragic 9.3% |
| Ukrainians | 0.7 /100 | #263 | Tragic 9.3% |
| Iroquois | 0.7 /100 | #264 | Tragic 9.3% |
| Palestinians | 0.6 /100 | #265 | Tragic 9.3% |
| Blacks/African Americans | 0.5 /100 | #266 | Tragic 9.4% |
| Immigrants | Mexico | 0.4 /100 | #267 | Tragic 9.4% |
| Greeks | 0.4 /100 | #268 | Tragic 9.4% |
| Puerto Ricans | 0.3 /100 | #269 | Tragic 9.4% |
| Yaqui | 0.3 /100 | #270 | Tragic 9.4% |
Demographics Similar to Seminole by Unemployment Among Seniors over 75 years
In terms of unemployment among seniors over 75 years, the demographic groups most similar to Seminole are Immigrants from Switzerland (7.2%, a difference of 1.0%), Icelander (7.0%, a difference of 1.3%), Immigrants from Uzbekistan (7.2%, a difference of 1.3%), Immigrants from Zaire (7.2%, a difference of 1.4%), and Armenian (7.2%, a difference of 1.8%).
| Demographics | Rating | Rank | Unemployment Among Seniors over 75 years |
| Soviet Union | 100.0 /100 | #9 | Exceptional 6.6% |
| Yuman | 100.0 /100 | #10 | Exceptional 6.7% |
| Immigrants | Grenada | 100.0 /100 | #11 | Exceptional 6.7% |
| Comanche | 100.0 /100 | #12 | Exceptional 6.7% |
| Immigrants | Congo | 100.0 /100 | #13 | Exceptional 6.7% |
| Ute | 100.0 /100 | #14 | Exceptional 6.8% |
| Icelanders | 100.0 /100 | #15 | Exceptional 7.0% |
| Seminole | 100.0 /100 | #16 | Exceptional 7.1% |
| Immigrants | Switzerland | 100.0 /100 | #17 | Exceptional 7.2% |
| Immigrants | Uzbekistan | 100.0 /100 | #18 | Exceptional 7.2% |
| Immigrants | Zaire | 100.0 /100 | #19 | Exceptional 7.2% |
| Armenians | 100.0 /100 | #20 | Exceptional 7.2% |
| Chickasaw | 100.0 /100 | #21 | Exceptional 7.3% |
| Cypriots | 100.0 /100 | #22 | Exceptional 7.4% |
| Israelis | 100.0 /100 | #23 | Exceptional 7.4% |