Ukrainian vs Kiowa Unemployment Among Seniors over 65 years
COMPARE
Ukrainian
Kiowa
Unemployment Among Seniors over 65 years
Unemployment Among Seniors over 65 years Comparison
Ukrainians
Kiowa
5.1%
UNEMPLOYMENT AMONG SENIORS OVER 65 YEARS
84.4/ 100
METRIC RATING
135th/ 347
METRIC RANK
4.8%
UNEMPLOYMENT AMONG SENIORS OVER 65 YEARS
99.9/ 100
METRIC RATING
41st/ 347
METRIC RANK
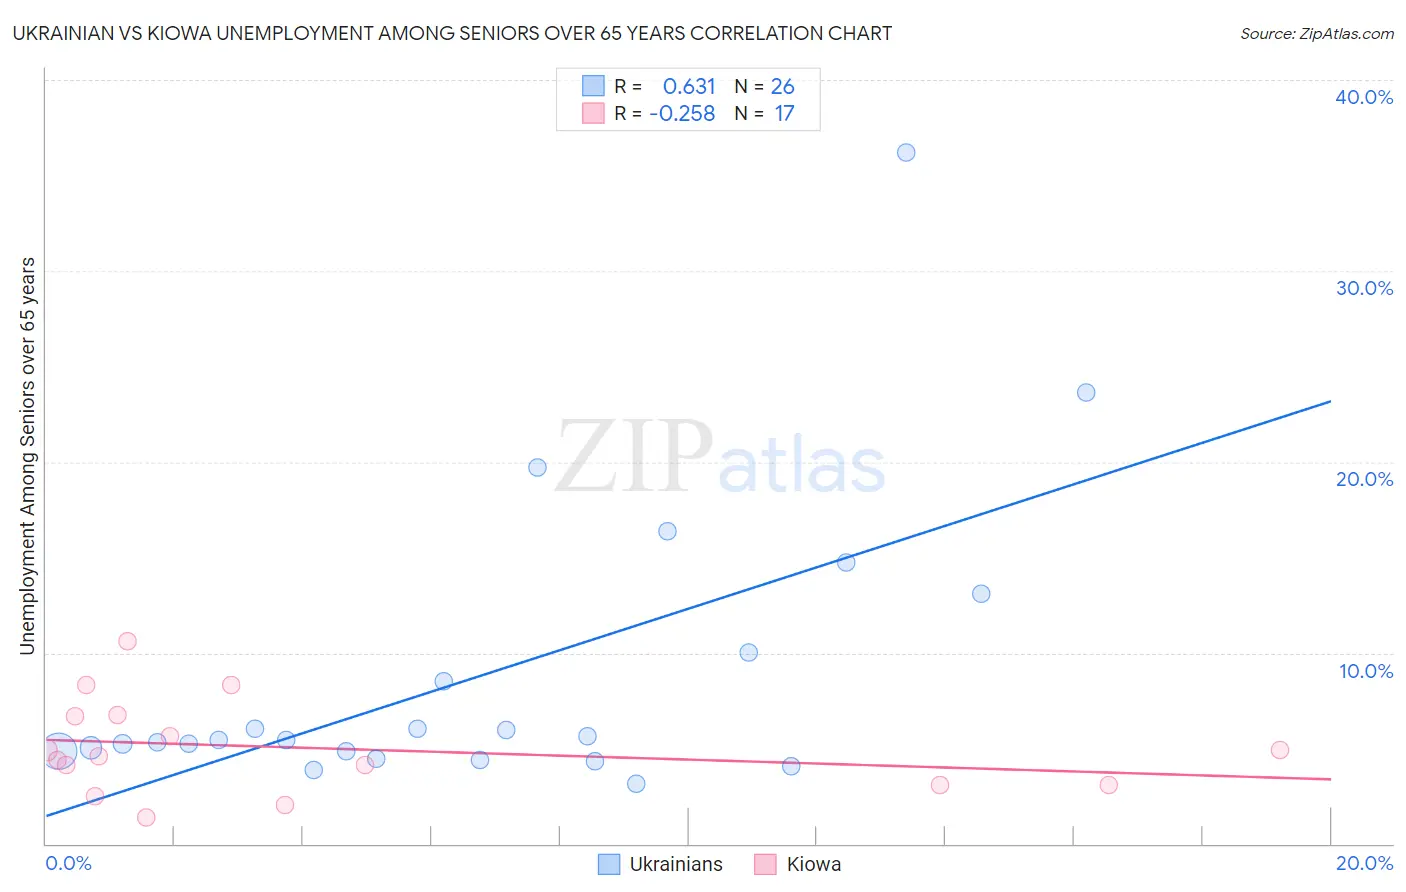
Ukrainian vs Kiowa Unemployment Among Seniors over 65 years Correlation Chart
The statistical analysis conducted on geographies consisting of 393,291,224 people shows a significant positive correlation between the proportion of Ukrainians and unemployment rate amomg seniors over the age of 65 in the United States with a correlation coefficient (R) of 0.631 and weighted average of 5.1%. Similarly, the statistical analysis conducted on geographies consisting of 54,066,098 people shows a weak negative correlation between the proportion of Kiowa and unemployment rate amomg seniors over the age of 65 in the United States with a correlation coefficient (R) of -0.258 and weighted average of 4.8%, a difference of 4.7%.
Unemployment Among Seniors over 65 years Correlation Summary
| Measurement | Ukrainian | Kiowa |
| Minimum | 3.1% | 1.4% |
| Maximum | 36.2% | 10.6% |
| Range | 33.1% | 9.2% |
| Mean | 8.9% | 5.0% |
| Median | 5.4% | 4.6% |
| Interquartile 25% (IQ1) | 4.8% | 3.1% |
| Interquartile 75% (IQ3) | 10.0% | 6.7% |
| Interquartile Range (IQR) | 5.2% | 3.6% |
| Standard Deviation (Sample) | 7.7% | 2.5% |
| Standard Deviation (Population) | 7.5% | 2.4% |
Similar Demographics by Unemployment Among Seniors over 65 years
Demographics Similar to Ukrainians by Unemployment Among Seniors over 65 years
In terms of unemployment among seniors over 65 years, the demographic groups most similar to Ukrainians are White/Caucasian (5.1%, a difference of 0.0%), Arab (5.1%, a difference of 0.010%), Turkish (5.1%, a difference of 0.030%), Syrian (5.1%, a difference of 0.050%), and Chilean (5.1%, a difference of 0.070%).
| Demographics | Rating | Rank | Unemployment Among Seniors over 65 years |
| Australians | 87.1 /100 | #128 | Excellent 5.1% |
| Immigrants | England | 86.7 /100 | #129 | Excellent 5.1% |
| Iranians | 86.6 /100 | #130 | Excellent 5.1% |
| Immigrants | Australia | 85.8 /100 | #131 | Excellent 5.1% |
| Chileans | 85.6 /100 | #132 | Excellent 5.1% |
| Syrians | 85.3 /100 | #133 | Excellent 5.1% |
| Turks | 84.9 /100 | #134 | Excellent 5.1% |
| Ukrainians | 84.4 /100 | #135 | Excellent 5.1% |
| Whites/Caucasians | 84.4 /100 | #136 | Excellent 5.1% |
| Arabs | 84.3 /100 | #137 | Excellent 5.1% |
| New Zealanders | 83.2 /100 | #138 | Excellent 5.1% |
| Immigrants | Panama | 83.0 /100 | #139 | Excellent 5.1% |
| Immigrants | Chile | 83.0 /100 | #140 | Excellent 5.1% |
| Cherokee | 81.6 /100 | #141 | Excellent 5.1% |
| Immigrants | Indonesia | 81.0 /100 | #142 | Excellent 5.1% |
Demographics Similar to Kiowa by Unemployment Among Seniors over 65 years
In terms of unemployment among seniors over 65 years, the demographic groups most similar to Kiowa are Swiss (4.8%, a difference of 0.0%), Luxembourger (4.8%, a difference of 0.010%), Immigrants from Sweden (4.8%, a difference of 0.050%), Jordanian (4.9%, a difference of 0.11%), and Ethiopian (4.9%, a difference of 0.15%).
| Demographics | Rating | Rank | Unemployment Among Seniors over 65 years |
| Bhutanese | 100.0 /100 | #34 | Exceptional 4.8% |
| Immigrants | Kuwait | 100.0 /100 | #35 | Exceptional 4.8% |
| Cambodians | 100.0 /100 | #36 | Exceptional 4.8% |
| Bulgarians | 99.9 /100 | #37 | Exceptional 4.8% |
| Immigrants | India | 99.9 /100 | #38 | Exceptional 4.8% |
| Macedonians | 99.9 /100 | #39 | Exceptional 4.8% |
| Immigrants | Sweden | 99.9 /100 | #40 | Exceptional 4.8% |
| Kiowa | 99.9 /100 | #41 | Exceptional 4.8% |
| Swiss | 99.9 /100 | #42 | Exceptional 4.8% |
| Luxembourgers | 99.9 /100 | #43 | Exceptional 4.8% |
| Jordanians | 99.9 /100 | #44 | Exceptional 4.9% |
| Ethiopians | 99.9 /100 | #45 | Exceptional 4.9% |
| Immigrants | Jordan | 99.9 /100 | #46 | Exceptional 4.9% |
| Germans | 99.9 /100 | #47 | Exceptional 4.9% |
| Choctaw | 99.9 /100 | #48 | Exceptional 4.9% |