Ugandan vs Puget Sound Salish Unemployment Among Ages 60 to 64 years
COMPARE
Ugandan
Puget Sound Salish
Unemployment Among Ages 60 to 64 years
Unemployment Among Ages 60 to 64 years Comparison
Ugandans
Puget Sound Salish
4.9%
UNEMPLOYMENT AMONG AGES 60 TO 64 YEARS
10.5/ 100
METRIC RATING
221st/ 347
METRIC RANK
4.6%
UNEMPLOYMENT AMONG AGES 60 TO 64 YEARS
99.8/ 100
METRIC RATING
60th/ 347
METRIC RANK
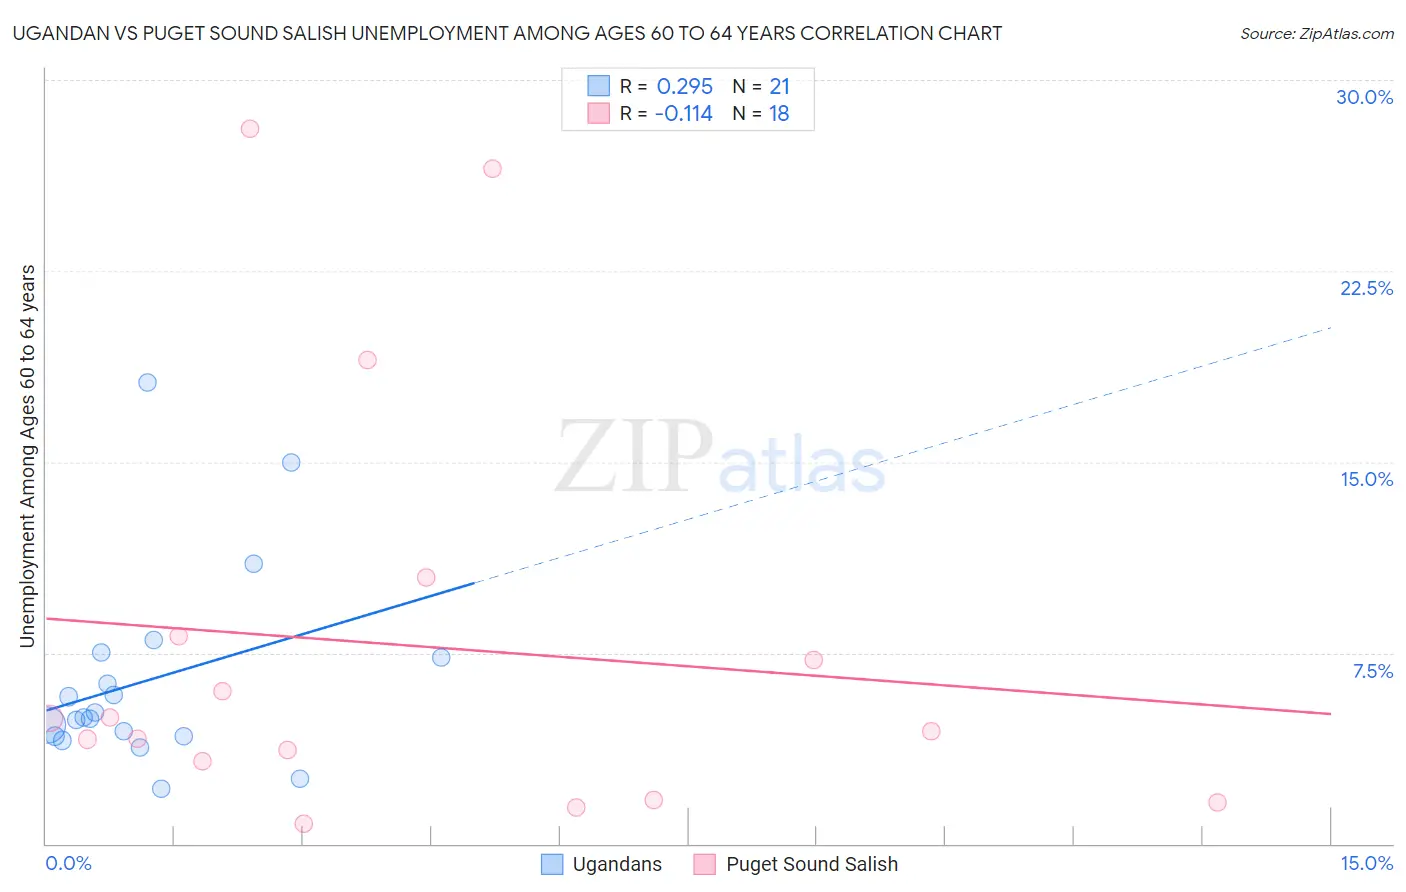
Ugandan vs Puget Sound Salish Unemployment Among Ages 60 to 64 years Correlation Chart
The statistical analysis conducted on geographies consisting of 91,721,696 people shows a weak positive correlation between the proportion of Ugandans and unemployment rate among population between the ages 60 and 64 in the United States with a correlation coefficient (R) of 0.295 and weighted average of 4.9%. Similarly, the statistical analysis conducted on geographies consisting of 43,665,697 people shows a poor negative correlation between the proportion of Puget Sound Salish and unemployment rate among population between the ages 60 and 64 in the United States with a correlation coefficient (R) of -0.114 and weighted average of 4.6%, a difference of 7.9%.
Unemployment Among Ages 60 to 64 years Correlation Summary
| Measurement | Ugandan | Puget Sound Salish |
| Minimum | 2.2% | 0.80% |
| Maximum | 18.1% | 28.1% |
| Range | 16.0% | 27.3% |
| Mean | 6.4% | 7.8% |
| Median | 4.9% | 4.7% |
| Interquartile 25% (IQ1) | 4.2% | 3.2% |
| Interquartile 75% (IQ3) | 7.4% | 8.1% |
| Interquartile Range (IQR) | 3.2% | 4.9% |
| Standard Deviation (Sample) | 3.9% | 8.2% |
| Standard Deviation (Population) | 3.8% | 8.0% |
Similar Demographics by Unemployment Among Ages 60 to 64 years
Demographics Similar to Ugandans by Unemployment Among Ages 60 to 64 years
In terms of unemployment among ages 60 to 64 years, the demographic groups most similar to Ugandans are Brazilian (5.0%, a difference of 0.040%), Crow (5.0%, a difference of 0.080%), Ottawa (4.9%, a difference of 0.10%), Immigrants from Brazil (4.9%, a difference of 0.11%), and Immigrants from Singapore (4.9%, a difference of 0.13%).
| Demographics | Rating | Rank | Unemployment Among Ages 60 to 64 years |
| Immigrants | Russia | 13.7 /100 | #214 | Poor 4.9% |
| Immigrants | South Eastern Asia | 13.1 /100 | #215 | Poor 4.9% |
| Cajuns | 12.3 /100 | #216 | Poor 4.9% |
| Koreans | 12.2 /100 | #217 | Poor 4.9% |
| Immigrants | Singapore | 12.0 /100 | #218 | Poor 4.9% |
| Immigrants | Brazil | 11.7 /100 | #219 | Poor 4.9% |
| Ottawa | 11.6 /100 | #220 | Poor 4.9% |
| Ugandans | 10.5 /100 | #221 | Poor 4.9% |
| Brazilians | 10.1 /100 | #222 | Poor 5.0% |
| Crow | 9.7 /100 | #223 | Tragic 5.0% |
| Immigrants | Cameroon | 8.5 /100 | #224 | Tragic 5.0% |
| Immigrants | Ireland | 7.2 /100 | #225 | Tragic 5.0% |
| Immigrants | Chile | 6.8 /100 | #226 | Tragic 5.0% |
| Nigerians | 6.8 /100 | #227 | Tragic 5.0% |
| Immigrants | Belarus | 6.4 /100 | #228 | Tragic 5.0% |
Demographics Similar to Puget Sound Salish by Unemployment Among Ages 60 to 64 years
In terms of unemployment among ages 60 to 64 years, the demographic groups most similar to Puget Sound Salish are Swiss (4.6%, a difference of 0.020%), Immigrants from India (4.6%, a difference of 0.12%), British (4.6%, a difference of 0.17%), Welsh (4.6%, a difference of 0.18%), and Bangladeshi (4.6%, a difference of 0.27%).
| Demographics | Rating | Rank | Unemployment Among Ages 60 to 64 years |
| Immigrants | Moldova | 99.9 /100 | #53 | Exceptional 4.6% |
| Dutch | 99.9 /100 | #54 | Exceptional 4.6% |
| Bangladeshis | 99.9 /100 | #55 | Exceptional 4.6% |
| Welsh | 99.9 /100 | #56 | Exceptional 4.6% |
| British | 99.9 /100 | #57 | Exceptional 4.6% |
| Immigrants | India | 99.8 /100 | #58 | Exceptional 4.6% |
| Swiss | 99.8 /100 | #59 | Exceptional 4.6% |
| Puget Sound Salish | 99.8 /100 | #60 | Exceptional 4.6% |
| Lebanese | 99.8 /100 | #61 | Exceptional 4.6% |
| Senegalese | 99.7 /100 | #62 | Exceptional 4.6% |
| Czechoslovakians | 99.7 /100 | #63 | Exceptional 4.6% |
| Immigrants | Middle Africa | 99.7 /100 | #64 | Exceptional 4.6% |
| Jordanians | 99.7 /100 | #65 | Exceptional 4.6% |
| Hawaiians | 99.6 /100 | #66 | Exceptional 4.6% |
| Immigrants | Scotland | 99.6 /100 | #67 | Exceptional 4.6% |