Ugandan vs Haitian Unemployment Among Ages 55 to 59 years
COMPARE
Ugandan
Haitian
Unemployment Among Ages 55 to 59 years
Unemployment Among Ages 55 to 59 years Comparison
Ugandans
Haitians
4.6%
UNEMPLOYMENT AMONG AGES 55 TO 59 YEARS
99.0/ 100
METRIC RATING
67th/ 347
METRIC RANK
4.9%
UNEMPLOYMENT AMONG AGES 55 TO 59 YEARS
18.1/ 100
METRIC RATING
205th/ 347
METRIC RANK
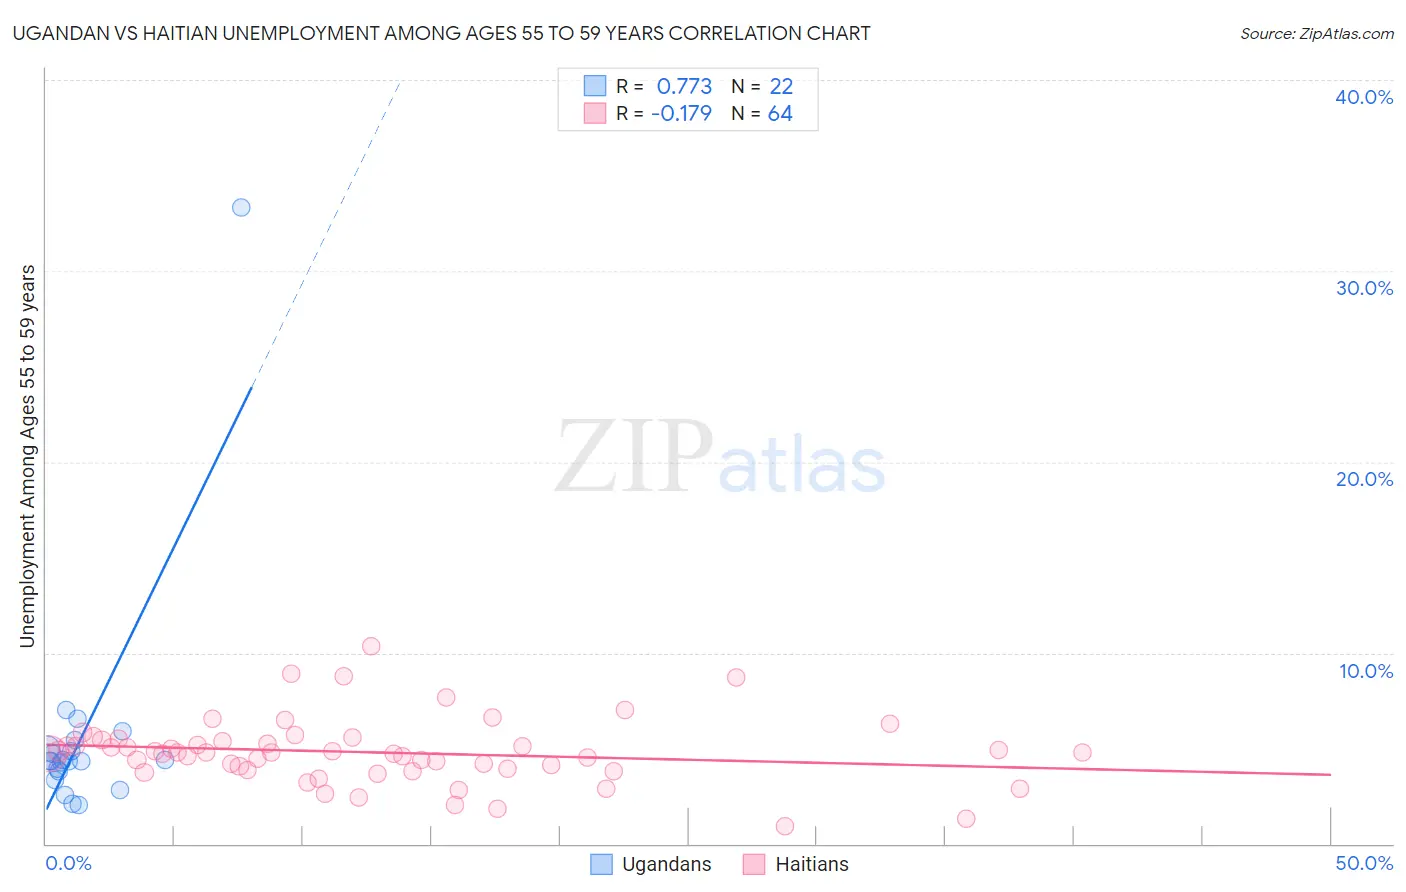
Ugandan vs Haitian Unemployment Among Ages 55 to 59 years Correlation Chart
The statistical analysis conducted on geographies consisting of 92,407,500 people shows a strong positive correlation between the proportion of Ugandans and unemployment rate among population between the ages 55 and 59 in the United States with a correlation coefficient (R) of 0.773 and weighted average of 4.6%. Similarly, the statistical analysis conducted on geographies consisting of 272,911,184 people shows a poor negative correlation between the proportion of Haitians and unemployment rate among population between the ages 55 and 59 in the United States with a correlation coefficient (R) of -0.179 and weighted average of 4.9%, a difference of 6.5%.
Unemployment Among Ages 55 to 59 years Correlation Summary
| Measurement | Ugandan | Haitian |
| Minimum | 2.0% | 0.90% |
| Maximum | 33.3% | 10.3% |
| Range | 31.3% | 9.4% |
| Mean | 5.6% | 4.8% |
| Median | 4.3% | 4.8% |
| Interquartile 25% (IQ1) | 3.8% | 3.9% |
| Interquartile 75% (IQ3) | 5.0% | 5.4% |
| Interquartile Range (IQR) | 1.2% | 1.5% |
| Standard Deviation (Sample) | 6.3% | 1.7% |
| Standard Deviation (Population) | 6.2% | 1.7% |
Similar Demographics by Unemployment Among Ages 55 to 59 years
Demographics Similar to Ugandans by Unemployment Among Ages 55 to 59 years
In terms of unemployment among ages 55 to 59 years, the demographic groups most similar to Ugandans are Immigrants from Micronesia (4.6%, a difference of 0.010%), Czechoslovakian (4.6%, a difference of 0.020%), Mongolian (4.6%, a difference of 0.040%), Sudanese (4.6%, a difference of 0.17%), and Argentinean (4.6%, a difference of 0.18%).
| Demographics | Rating | Rank | Unemployment Among Ages 55 to 59 years |
| Dutch | 99.5 /100 | #60 | Exceptional 4.6% |
| Immigrants | Argentina | 99.5 /100 | #61 | Exceptional 4.6% |
| Slovenes | 99.3 /100 | #62 | Exceptional 4.6% |
| Immigrants | South Central Asia | 99.3 /100 | #63 | Exceptional 4.6% |
| Argentineans | 99.1 /100 | #64 | Exceptional 4.6% |
| Sudanese | 99.1 /100 | #65 | Exceptional 4.6% |
| Mongolians | 99.0 /100 | #66 | Exceptional 4.6% |
| Ugandans | 99.0 /100 | #67 | Exceptional 4.6% |
| Immigrants | Micronesia | 99.0 /100 | #68 | Exceptional 4.6% |
| Czechoslovakians | 99.0 /100 | #69 | Exceptional 4.6% |
| Filipinos | 98.8 /100 | #70 | Exceptional 4.6% |
| Immigrants | Jordan | 98.7 /100 | #71 | Exceptional 4.6% |
| Immigrants | Taiwan | 98.7 /100 | #72 | Exceptional 4.6% |
| Bhutanese | 98.6 /100 | #73 | Exceptional 4.6% |
| Croatians | 98.5 /100 | #74 | Exceptional 4.6% |
Demographics Similar to Haitians by Unemployment Among Ages 55 to 59 years
In terms of unemployment among ages 55 to 59 years, the demographic groups most similar to Haitians are Immigrants from Latvia (4.9%, a difference of 0.020%), Guamanian/Chamorro (4.9%, a difference of 0.17%), Lumbee (4.9%, a difference of 0.27%), Immigrants from Belarus (4.9%, a difference of 0.30%), and Immigrants from Australia (4.9%, a difference of 0.30%).
| Demographics | Rating | Rank | Unemployment Among Ages 55 to 59 years |
| Immigrants | Philippines | 26.1 /100 | #198 | Fair 4.9% |
| Immigrants | Russia | 23.7 /100 | #199 | Fair 4.9% |
| Basques | 23.3 /100 | #200 | Fair 4.9% |
| Immigrants | South America | 23.1 /100 | #201 | Fair 4.9% |
| Lumbee | 22.5 /100 | #202 | Fair 4.9% |
| Guamanians/Chamorros | 20.8 /100 | #203 | Fair 4.9% |
| Immigrants | Latvia | 18.5 /100 | #204 | Poor 4.9% |
| Haitians | 18.1 /100 | #205 | Poor 4.9% |
| Immigrants | Belarus | 14.1 /100 | #206 | Poor 4.9% |
| Immigrants | Australia | 14.1 /100 | #207 | Poor 4.9% |
| Immigrants | Kazakhstan | 14.0 /100 | #208 | Poor 4.9% |
| Immigrants | Haiti | 13.3 /100 | #209 | Poor 4.9% |
| Creek | 12.9 /100 | #210 | Poor 4.9% |
| Hawaiians | 12.8 /100 | #211 | Poor 4.9% |
| Immigrants | Nonimmigrants | 11.2 /100 | #212 | Poor 4.9% |