Turkish vs White/Caucasian Unemployment Among Seniors over 75 years
COMPARE
Turkish
White/Caucasian
Unemployment Among Seniors over 75 years
Unemployment Among Seniors over 75 years Comparison
Turks
Whites/Caucasians
8.6%
UNEMPLOYMENT AMONG SENIORS OVER 75 YEARS
76.4/ 100
METRIC RATING
157th/ 347
METRIC RANK
10.1%
UNEMPLOYMENT AMONG SENIORS OVER 75 YEARS
0.0/ 100
METRIC RATING
308th/ 347
METRIC RANK
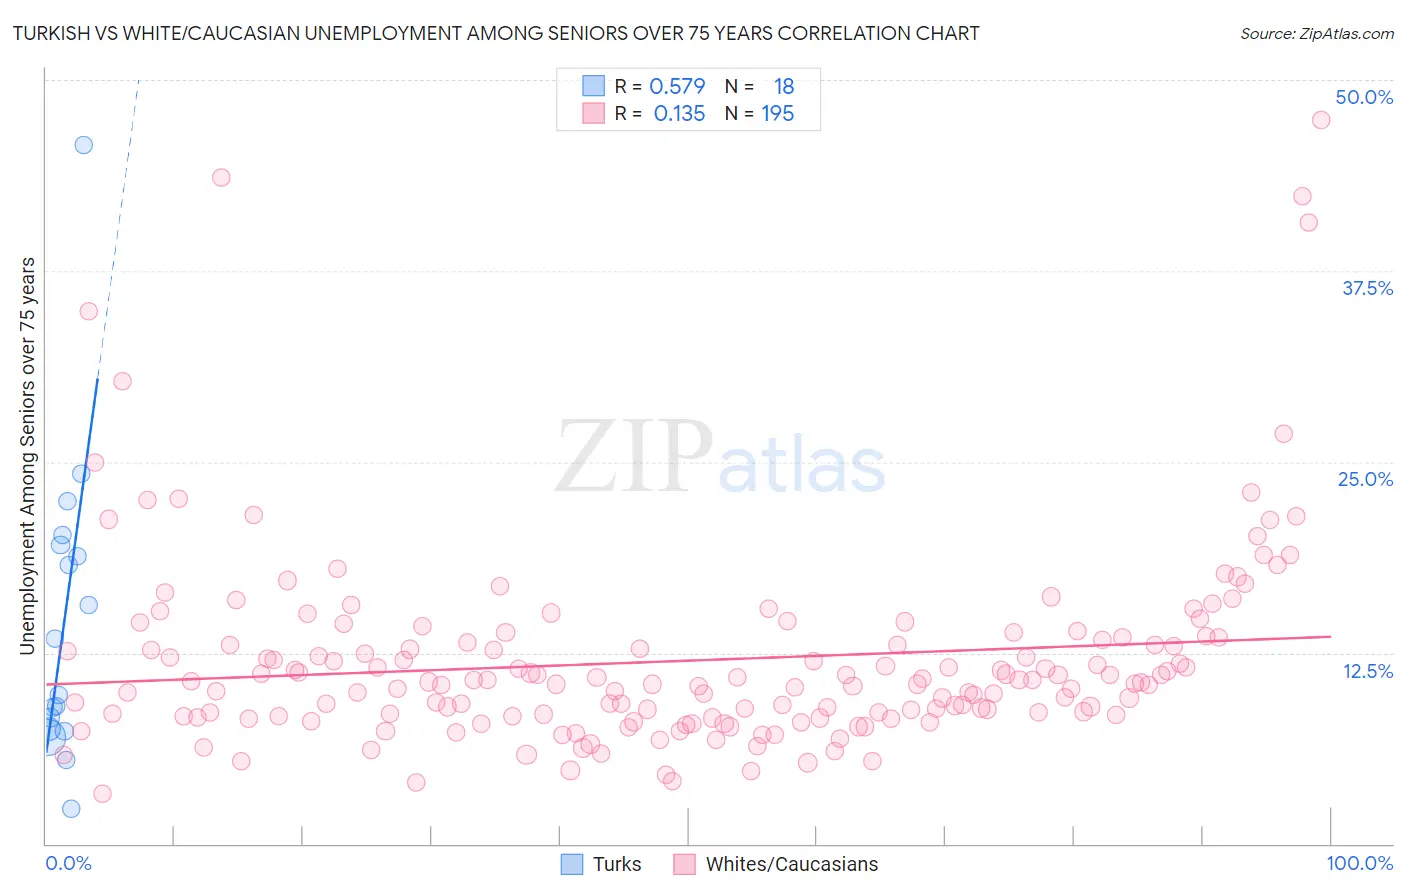
Turkish vs White/Caucasian Unemployment Among Seniors over 75 years Correlation Chart
The statistical analysis conducted on geographies consisting of 161,663,985 people shows a substantial positive correlation between the proportion of Turks and unemployment rate among seniors over the age of 75 in the United States with a correlation coefficient (R) of 0.579 and weighted average of 8.6%. Similarly, the statistical analysis conducted on geographies consisting of 235,408,651 people shows a poor positive correlation between the proportion of Whites/Caucasians and unemployment rate among seniors over the age of 75 in the United States with a correlation coefficient (R) of 0.135 and weighted average of 10.1%, a difference of 16.9%.
Unemployment Among Seniors over 75 years Correlation Summary
| Measurement | Turkish | White/Caucasian |
| Minimum | 2.3% | 3.3% |
| Maximum | 45.7% | 47.4% |
| Range | 43.4% | 44.1% |
| Mean | 14.7% | 12.0% |
| Median | 11.6% | 10.6% |
| Interquartile 25% (IQ1) | 7.5% | 8.4% |
| Interquartile 75% (IQ3) | 19.6% | 13.4% |
| Interquartile Range (IQR) | 12.0% | 5.0% |
| Standard Deviation (Sample) | 10.1% | 6.5% |
| Standard Deviation (Population) | 9.8% | 6.5% |
Similar Demographics by Unemployment Among Seniors over 75 years
Demographics Similar to Turks by Unemployment Among Seniors over 75 years
In terms of unemployment among seniors over 75 years, the demographic groups most similar to Turks are Immigrants from Bahamas (8.6%, a difference of 0.010%), Ethiopian (8.6%, a difference of 0.080%), Shoshone (8.6%, a difference of 0.13%), Ecuadorian (8.6%, a difference of 0.17%), and Cree (8.6%, a difference of 0.25%).
| Demographics | Rating | Rank | Unemployment Among Seniors over 75 years |
| Paiute | 82.5 /100 | #150 | Excellent 8.6% |
| Immigrants | Bosnia and Herzegovina | 80.6 /100 | #151 | Excellent 8.6% |
| Latvians | 80.5 /100 | #152 | Excellent 8.6% |
| Mongolians | 80.1 /100 | #153 | Excellent 8.6% |
| Immigrants | Pakistan | 79.7 /100 | #154 | Good 8.6% |
| Ecuadorians | 78.5 /100 | #155 | Good 8.6% |
| Immigrants | Bahamas | 76.5 /100 | #156 | Good 8.6% |
| Turks | 76.4 /100 | #157 | Good 8.6% |
| Ethiopians | 75.3 /100 | #158 | Good 8.6% |
| Shoshone | 74.6 /100 | #159 | Good 8.6% |
| Cree | 72.8 /100 | #160 | Good 8.6% |
| Albanians | 72.8 /100 | #161 | Good 8.6% |
| Immigrants | South America | 71.3 /100 | #162 | Good 8.6% |
| Immigrants | Guatemala | 68.4 /100 | #163 | Good 8.7% |
| Paraguayans | 62.2 /100 | #164 | Good 8.7% |
Demographics Similar to Whites/Caucasians by Unemployment Among Seniors over 75 years
In terms of unemployment among seniors over 75 years, the demographic groups most similar to Whites/Caucasians are English (10.1%, a difference of 0.070%), Hungarian (10.1%, a difference of 0.25%), Scottish (10.1%, a difference of 0.37%), Chippewa (10.1%, a difference of 0.38%), and Immigrants from Fiji (10.0%, a difference of 0.44%).
| Demographics | Rating | Rank | Unemployment Among Seniors over 75 years |
| Welsh | 0.0 /100 | #301 | Tragic 10.0% |
| Finns | 0.0 /100 | #302 | Tragic 10.0% |
| Puget Sound Salish | 0.0 /100 | #303 | Tragic 10.0% |
| Scotch-Irish | 0.0 /100 | #304 | Tragic 10.0% |
| Swedes | 0.0 /100 | #305 | Tragic 10.0% |
| Italians | 0.0 /100 | #306 | Tragic 10.0% |
| Immigrants | Fiji | 0.0 /100 | #307 | Tragic 10.0% |
| Whites/Caucasians | 0.0 /100 | #308 | Tragic 10.1% |
| English | 0.0 /100 | #309 | Tragic 10.1% |
| Hungarians | 0.0 /100 | #310 | Tragic 10.1% |
| Scottish | 0.0 /100 | #311 | Tragic 10.1% |
| Chippewa | 0.0 /100 | #312 | Tragic 10.1% |
| Nepalese | 0.0 /100 | #313 | Tragic 10.1% |
| Dutch West Indians | 0.0 /100 | #314 | Tragic 10.2% |
| Pennsylvania Germans | 0.0 /100 | #315 | Tragic 10.2% |