Turkish vs Irish Unemployment Among Ages 60 to 64 years
COMPARE
Turkish
Irish
Unemployment Among Ages 60 to 64 years
Unemployment Among Ages 60 to 64 years Comparison
Turks
Irish
4.8%
UNEMPLOYMENT AMONG AGES 60 TO 64 YEARS
81.9/ 100
METRIC RATING
146th/ 347
METRIC RANK
4.7%
UNEMPLOYMENT AMONG AGES 60 TO 64 YEARS
99.2/ 100
METRIC RATING
79th/ 347
METRIC RANK
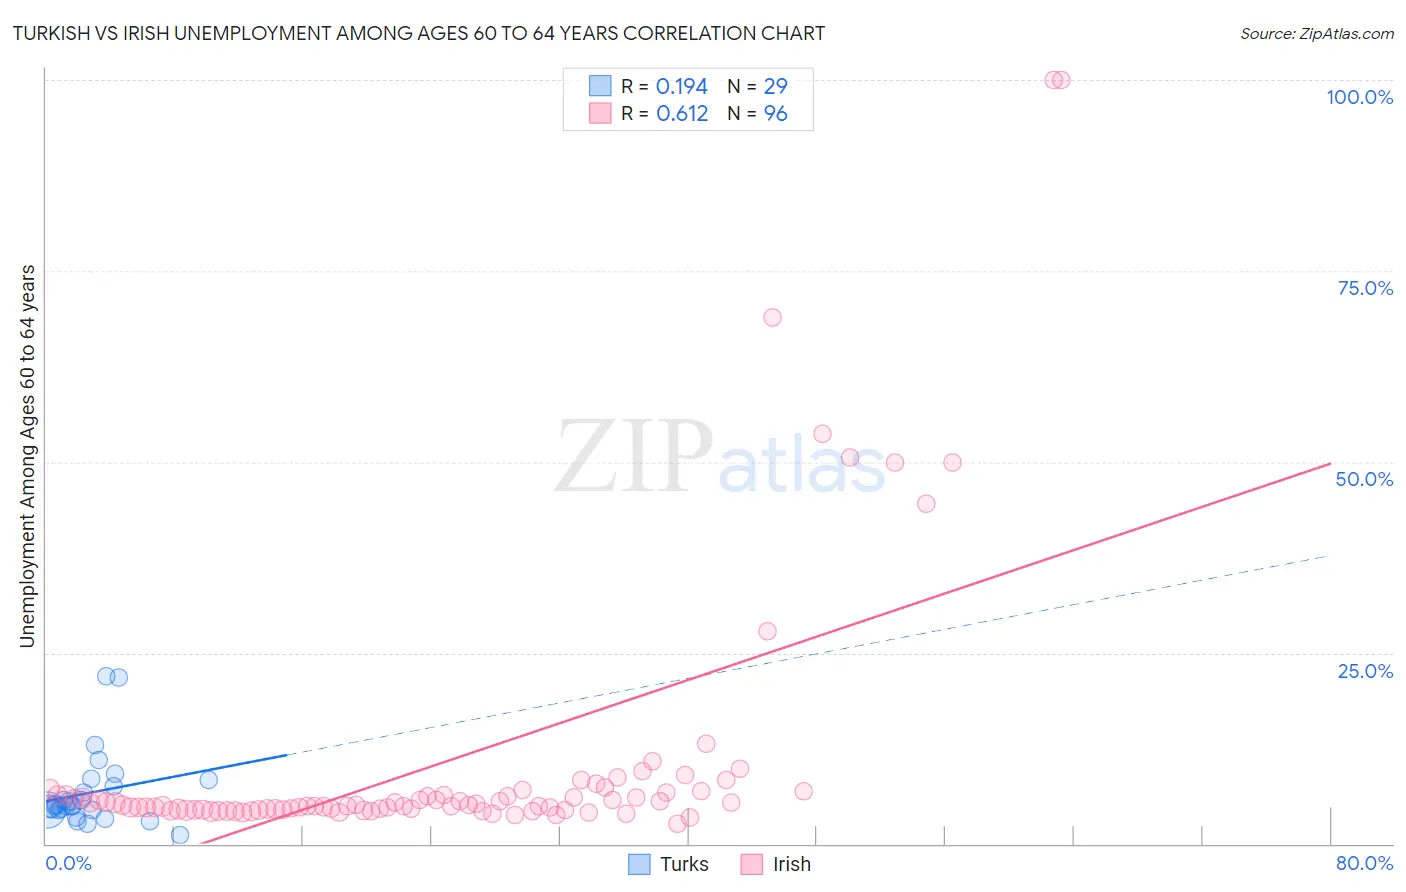
Turkish vs Irish Unemployment Among Ages 60 to 64 years Correlation Chart
The statistical analysis conducted on geographies consisting of 255,193,666 people shows a poor positive correlation between the proportion of Turks and unemployment rate among population between the ages 60 and 64 in the United States with a correlation coefficient (R) of 0.194 and weighted average of 4.8%. Similarly, the statistical analysis conducted on geographies consisting of 468,149,773 people shows a significant positive correlation between the proportion of Irish and unemployment rate among population between the ages 60 and 64 in the United States with a correlation coefficient (R) of 0.612 and weighted average of 4.7%, a difference of 3.0%.
Unemployment Among Ages 60 to 64 years Correlation Summary
| Measurement | Turkish | Irish |
| Minimum | 1.2% | 2.6% |
| Maximum | 22.0% | 100.0% |
| Range | 20.8% | 97.4% |
| Mean | 6.7% | 10.7% |
| Median | 4.9% | 5.1% |
| Interquartile 25% (IQ1) | 4.4% | 4.5% |
| Interquartile 75% (IQ3) | 7.9% | 6.6% |
| Interquartile Range (IQR) | 3.5% | 2.1% |
| Standard Deviation (Sample) | 4.9% | 17.7% |
| Standard Deviation (Population) | 4.8% | 17.7% |
Similar Demographics by Unemployment Among Ages 60 to 64 years
Demographics Similar to Turks by Unemployment Among Ages 60 to 64 years
In terms of unemployment among ages 60 to 64 years, the demographic groups most similar to Turks are Mongolian (4.8%, a difference of 0.040%), Burmese (4.8%, a difference of 0.080%), Immigrants from Pakistan (4.8%, a difference of 0.090%), Latvian (4.8%, a difference of 0.16%), and Arab (4.8%, a difference of 0.17%).
| Demographics | Rating | Rank | Unemployment Among Ages 60 to 64 years |
| Immigrants | Africa | 86.6 /100 | #139 | Excellent 4.8% |
| Pima | 85.8 /100 | #140 | Excellent 4.8% |
| Panamanians | 85.5 /100 | #141 | Excellent 4.8% |
| Immigrants | Ethiopia | 85.3 /100 | #142 | Excellent 4.8% |
| Italians | 85.0 /100 | #143 | Excellent 4.8% |
| Immigrants | Pakistan | 83.3 /100 | #144 | Excellent 4.8% |
| Burmese | 83.1 /100 | #145 | Excellent 4.8% |
| Turks | 81.9 /100 | #146 | Excellent 4.8% |
| Mongolians | 81.2 /100 | #147 | Excellent 4.8% |
| Latvians | 79.1 /100 | #148 | Good 4.8% |
| Arabs | 78.8 /100 | #149 | Good 4.8% |
| Immigrants | Italy | 78.7 /100 | #150 | Good 4.8% |
| Immigrants | South Africa | 78.5 /100 | #151 | Good 4.8% |
| Americans | 75.7 /100 | #152 | Good 4.8% |
| Bolivians | 75.5 /100 | #153 | Good 4.8% |
Demographics Similar to Irish by Unemployment Among Ages 60 to 64 years
In terms of unemployment among ages 60 to 64 years, the demographic groups most similar to Irish are Seminole (4.7%, a difference of 0.030%), Icelander (4.7%, a difference of 0.030%), Iroquois (4.7%, a difference of 0.040%), Okinawan (4.7%, a difference of 0.040%), and Immigrants from Egypt (4.7%, a difference of 0.050%).
| Demographics | Rating | Rank | Unemployment Among Ages 60 to 64 years |
| Tongans | 99.5 /100 | #72 | Exceptional 4.6% |
| Immigrants | Eastern Africa | 99.5 /100 | #73 | Exceptional 4.6% |
| Northern Europeans | 99.3 /100 | #74 | Exceptional 4.6% |
| Potawatomi | 99.3 /100 | #75 | Exceptional 4.6% |
| Slovaks | 99.3 /100 | #76 | Exceptional 4.6% |
| Immigrants | Somalia | 99.2 /100 | #77 | Exceptional 4.6% |
| Seminole | 99.2 /100 | #78 | Exceptional 4.7% |
| Irish | 99.2 /100 | #79 | Exceptional 4.7% |
| Icelanders | 99.1 /100 | #80 | Exceptional 4.7% |
| Iroquois | 99.1 /100 | #81 | Exceptional 4.7% |
| Okinawans | 99.1 /100 | #82 | Exceptional 4.7% |
| Immigrants | Egypt | 99.1 /100 | #83 | Exceptional 4.7% |
| Thais | 98.9 /100 | #84 | Exceptional 4.7% |
| Immigrants | Sri Lanka | 98.9 /100 | #85 | Exceptional 4.7% |
| Immigrants | Oceania | 98.9 /100 | #86 | Exceptional 4.7% |