Trinidadian and Tobagonian vs West Indian Unemployment Among Ages 65 to 74 years
COMPARE
Trinidadian and Tobagonian
West Indian
Unemployment Among Ages 65 to 74 years
Unemployment Among Ages 65 to 74 years Comparison
Trinidadians and Tobagonians
West Indians
5.6%
UNEMPLOYMENT AMONG AGES 65 TO 74 YEARS
0.8/ 100
METRIC RATING
249th/ 347
METRIC RANK
5.5%
UNEMPLOYMENT AMONG AGES 65 TO 74 YEARS
2.7/ 100
METRIC RATING
229th/ 347
METRIC RANK
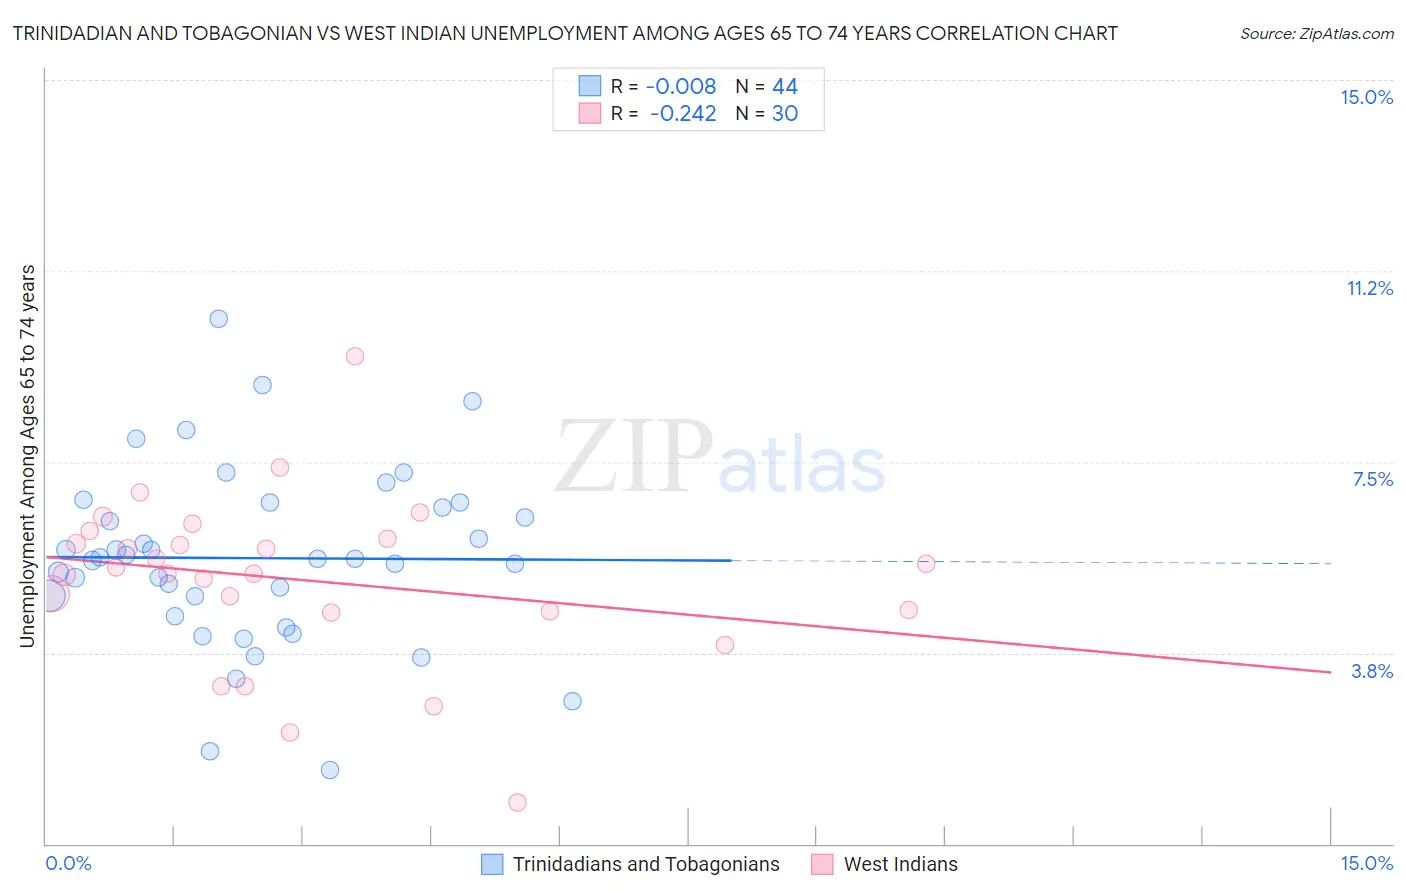
Trinidadian and Tobagonian vs West Indian Unemployment Among Ages 65 to 74 years Correlation Chart
The statistical analysis conducted on geographies consisting of 204,784,447 people shows no correlation between the proportion of Trinidadians and Tobagonians and unemployment rate among population between the ages 65 and 74 in the United States with a correlation coefficient (R) of -0.008 and weighted average of 5.6%. Similarly, the statistical analysis conducted on geographies consisting of 234,145,254 people shows a weak negative correlation between the proportion of West Indians and unemployment rate among population between the ages 65 and 74 in the United States with a correlation coefficient (R) of -0.242 and weighted average of 5.5%, a difference of 1.0%.
Unemployment Among Ages 65 to 74 years Correlation Summary
| Measurement | Trinidadian and Tobagonian | West Indian |
| Minimum | 1.4% | 0.80% |
| Maximum | 10.3% | 9.6% |
| Range | 8.9% | 8.8% |
| Mean | 5.6% | 5.2% |
| Median | 5.6% | 5.4% |
| Interquartile 25% (IQ1) | 4.7% | 4.6% |
| Interquartile 75% (IQ3) | 6.7% | 6.0% |
| Interquartile Range (IQR) | 2.0% | 1.4% |
| Standard Deviation (Sample) | 1.8% | 1.7% |
| Standard Deviation (Population) | 1.7% | 1.6% |
Demographics Similar to Trinidadians and Tobagonians and West Indians by Unemployment Among Ages 65 to 74 years
In terms of unemployment among ages 65 to 74 years, the demographic groups most similar to Trinidadians and Tobagonians are Immigrants (5.6%, a difference of 0.060%), Immigrants from Argentina (5.6%, a difference of 0.060%), Immigrants from Greece (5.6%, a difference of 0.12%), Paraguayan (5.6%, a difference of 0.12%), and Immigrants from Micronesia (5.6%, a difference of 0.13%). Similarly, the demographic groups most similar to West Indians are Immigrants from Caribbean (5.5%, a difference of 0.020%), Israeli (5.5%, a difference of 0.060%), Nigerian (5.5%, a difference of 0.070%), South American Indian (5.5%, a difference of 0.16%), and French American Indian (5.5%, a difference of 0.17%).
| Demographics | Rating | Rank | Unemployment Among Ages 65 to 74 years |
| West Indians | 2.7 /100 | #229 | Tragic 5.5% |
| Immigrants | Caribbean | 2.7 /100 | #230 | Tragic 5.5% |
| Israelis | 2.5 /100 | #231 | Tragic 5.5% |
| Nigerians | 2.5 /100 | #232 | Tragic 5.5% |
| South American Indians | 2.3 /100 | #233 | Tragic 5.5% |
| French American Indians | 2.2 /100 | #234 | Tragic 5.5% |
| Peruvians | 2.2 /100 | #235 | Tragic 5.5% |
| Hopi | 2.2 /100 | #236 | Tragic 5.5% |
| Immigrants | Belize | 2.2 /100 | #237 | Tragic 5.5% |
| Cajuns | 1.8 /100 | #238 | Tragic 5.5% |
| German Russians | 1.6 /100 | #239 | Tragic 5.5% |
| Ghanaians | 1.4 /100 | #240 | Tragic 5.6% |
| Cree | 1.4 /100 | #241 | Tragic 5.6% |
| Immigrants | Ghana | 1.4 /100 | #242 | Tragic 5.6% |
| Immigrants | Peru | 1.3 /100 | #243 | Tragic 5.6% |
| Immigrants | Micronesia | 0.9 /100 | #244 | Tragic 5.6% |
| Immigrants | Greece | 0.9 /100 | #245 | Tragic 5.6% |
| Paraguayans | 0.9 /100 | #246 | Tragic 5.6% |
| Immigrants | Immigrants | 0.9 /100 | #247 | Tragic 5.6% |
| Immigrants | Argentina | 0.9 /100 | #248 | Tragic 5.6% |
| Trinidadians and Tobagonians | 0.8 /100 | #249 | Tragic 5.6% |