Tohono O'odham vs Moroccan Unemployment Among Seniors over 65 years
COMPARE
Tohono O'odham
Moroccan
Unemployment Among Seniors over 65 years
Unemployment Among Seniors over 65 years Comparison
Tohono O'odham
Moroccans
6.1%
UNEMPLOYMENT AMONG SENIORS OVER 65 YEARS
0.0/ 100
METRIC RATING
334th/ 347
METRIC RANK
5.4%
UNEMPLOYMENT AMONG SENIORS OVER 65 YEARS
0.5/ 100
METRIC RATING
256th/ 347
METRIC RANK
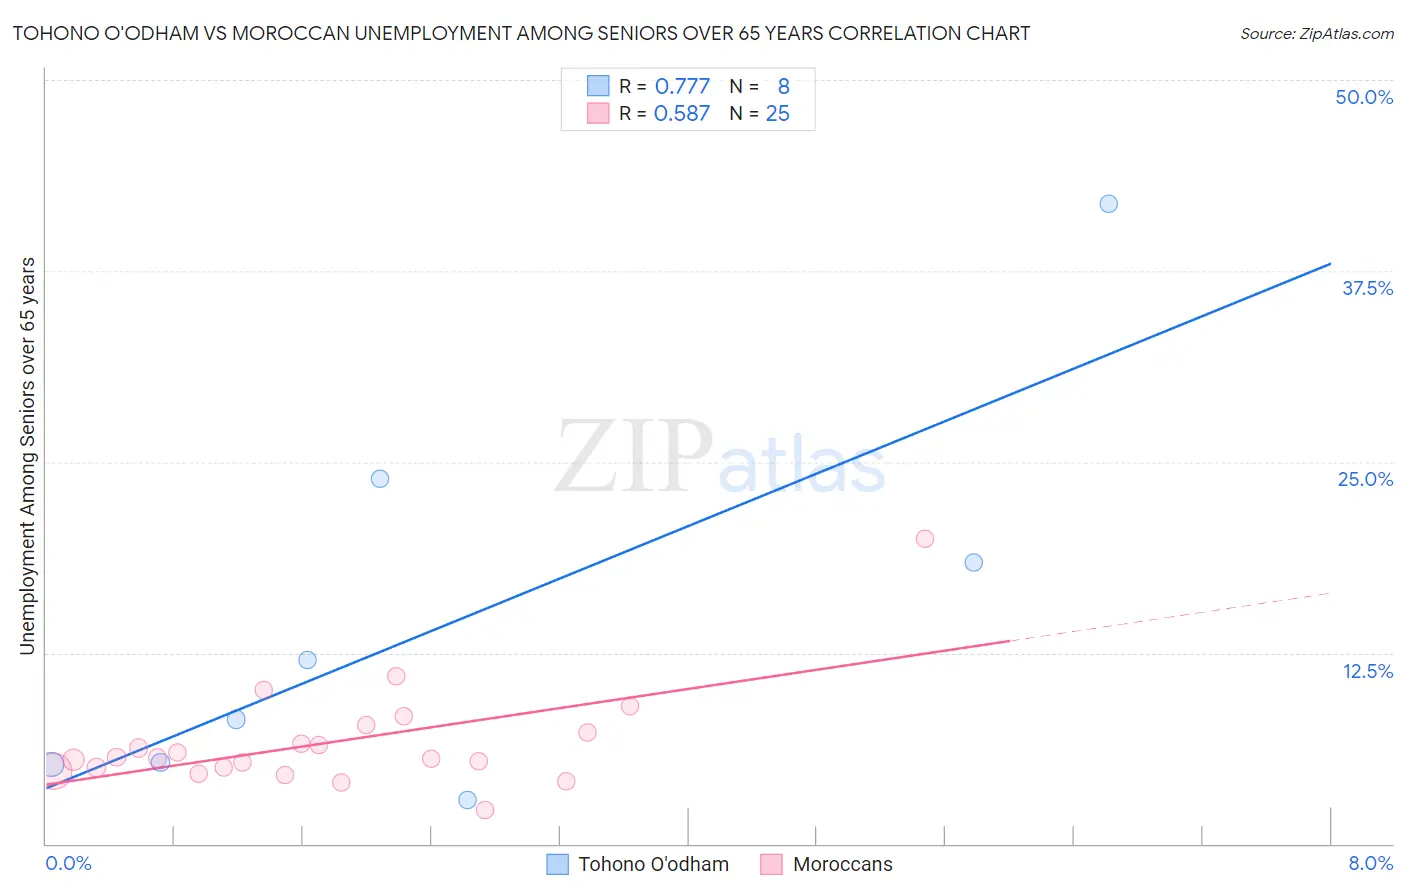
Tohono O'odham vs Moroccan Unemployment Among Seniors over 65 years Correlation Chart
The statistical analysis conducted on geographies consisting of 57,554,750 people shows a strong positive correlation between the proportion of Tohono O'odham and unemployment rate amomg seniors over the age of 65 in the United States with a correlation coefficient (R) of 0.777 and weighted average of 6.1%. Similarly, the statistical analysis conducted on geographies consisting of 191,654,032 people shows a substantial positive correlation between the proportion of Moroccans and unemployment rate amomg seniors over the age of 65 in the United States with a correlation coefficient (R) of 0.587 and weighted average of 5.4%, a difference of 14.4%.
Unemployment Among Seniors over 65 years Correlation Summary
| Measurement | Tohono O'odham | Moroccan |
| Minimum | 2.8% | 2.2% |
| Maximum | 41.9% | 20.0% |
| Range | 39.1% | 17.8% |
| Mean | 14.7% | 6.6% |
| Median | 10.1% | 5.6% |
| Interquartile 25% (IQ1) | 5.2% | 4.9% |
| Interquartile 75% (IQ3) | 21.1% | 7.5% |
| Interquartile Range (IQR) | 15.9% | 2.7% |
| Standard Deviation (Sample) | 13.1% | 3.4% |
| Standard Deviation (Population) | 12.3% | 3.3% |
Similar Demographics by Unemployment Among Seniors over 65 years
Demographics Similar to Tohono O'odham by Unemployment Among Seniors over 65 years
In terms of unemployment among seniors over 65 years, the demographic groups most similar to Tohono O'odham are Immigrants from Armenia (6.2%, a difference of 0.28%), Pima (6.3%, a difference of 2.1%), Immigrants from Dominican Republic (6.0%, a difference of 2.2%), Alaska Native (6.3%, a difference of 2.6%), and Aleut (6.0%, a difference of 2.7%).
| Demographics | Rating | Rank | Unemployment Among Seniors over 65 years |
| Bermudans | 0.0 /100 | #327 | Tragic 5.9% |
| Puerto Ricans | 0.0 /100 | #328 | Tragic 5.9% |
| Dominicans | 0.0 /100 | #329 | Tragic 6.0% |
| Immigrants | Portugal | 0.0 /100 | #330 | Tragic 6.0% |
| Taiwanese | 0.0 /100 | #331 | Tragic 6.0% |
| Aleuts | 0.0 /100 | #332 | Tragic 6.0% |
| Immigrants | Dominican Republic | 0.0 /100 | #333 | Tragic 6.0% |
| Tohono O'odham | 0.0 /100 | #334 | Tragic 6.1% |
| Immigrants | Armenia | 0.0 /100 | #335 | Tragic 6.2% |
| Pima | 0.0 /100 | #336 | Tragic 6.3% |
| Alaska Natives | 0.0 /100 | #337 | Tragic 6.3% |
| Immigrants | Azores | 0.0 /100 | #338 | Tragic 6.3% |
| Paiute | 0.0 /100 | #339 | Tragic 6.3% |
| Ute | 0.0 /100 | #340 | Tragic 6.3% |
| Yakama | 0.0 /100 | #341 | Tragic 6.7% |
Demographics Similar to Moroccans by Unemployment Among Seniors over 65 years
In terms of unemployment among seniors over 65 years, the demographic groups most similar to Moroccans are Paraguayan (5.4%, a difference of 0.030%), Immigrants from Peru (5.4%, a difference of 0.030%), Immigrants from Sierra Leone (5.4%, a difference of 0.090%), Immigrants from Micronesia (5.4%, a difference of 0.090%), and Trinidadian and Tobagonian (5.4%, a difference of 0.12%).
| Demographics | Rating | Rank | Unemployment Among Seniors over 65 years |
| Immigrants | Immigrants | 0.6 /100 | #249 | Tragic 5.4% |
| Ghanaians | 0.6 /100 | #250 | Tragic 5.4% |
| West Indians | 0.6 /100 | #251 | Tragic 5.4% |
| Trinidadians and Tobagonians | 0.6 /100 | #252 | Tragic 5.4% |
| Immigrants | Sierra Leone | 0.6 /100 | #253 | Tragic 5.4% |
| Paraguayans | 0.5 /100 | #254 | Tragic 5.4% |
| Immigrants | Peru | 0.5 /100 | #255 | Tragic 5.4% |
| Moroccans | 0.5 /100 | #256 | Tragic 5.4% |
| Immigrants | Micronesia | 0.4 /100 | #257 | Tragic 5.4% |
| Sierra Leoneans | 0.4 /100 | #258 | Tragic 5.4% |
| Immigrants | Ghana | 0.4 /100 | #259 | Tragic 5.4% |
| Native Hawaiians | 0.3 /100 | #260 | Tragic 5.4% |
| Spanish American Indians | 0.2 /100 | #261 | Tragic 5.4% |
| Immigrants | Grenada | 0.2 /100 | #262 | Tragic 5.4% |
| South Americans | 0.2 /100 | #263 | Tragic 5.4% |