Thai vs Jamaican Unemployment Among Ages 60 to 64 years
COMPARE
Thai
Jamaican
Unemployment Among Ages 60 to 64 years
Unemployment Among Ages 60 to 64 years Comparison
Thais
Jamaicans
4.7%
UNEMPLOYMENT AMONG AGES 60 TO 64 YEARS
98.9/ 100
METRIC RATING
84th/ 347
METRIC RANK
5.3%
UNEMPLOYMENT AMONG AGES 60 TO 64 YEARS
0.0/ 100
METRIC RATING
296th/ 347
METRIC RANK
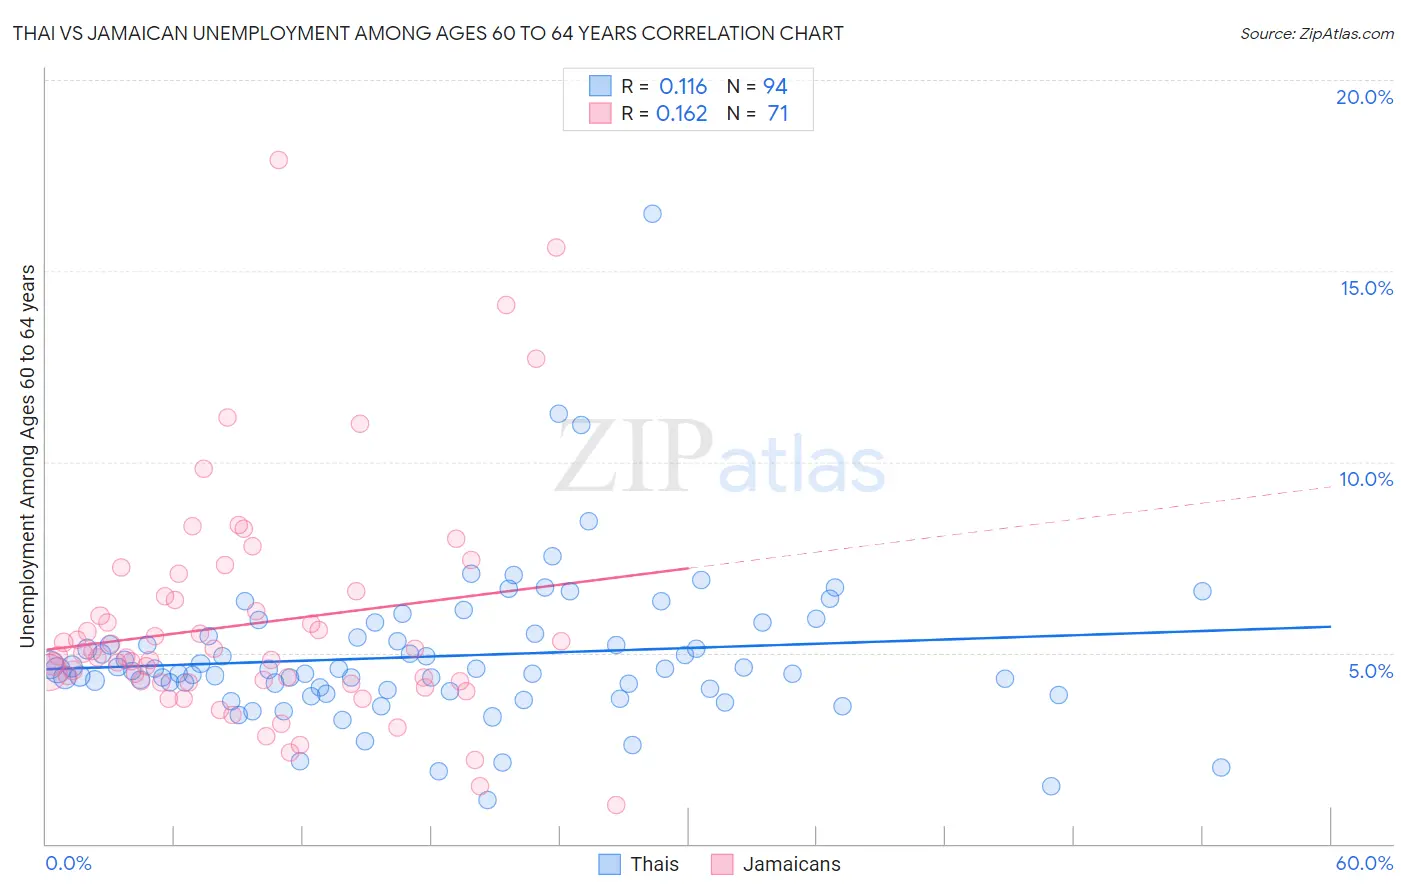
Thai vs Jamaican Unemployment Among Ages 60 to 64 years Correlation Chart
The statistical analysis conducted on geographies consisting of 420,414,129 people shows a poor positive correlation between the proportion of Thais and unemployment rate among population between the ages 60 and 64 in the United States with a correlation coefficient (R) of 0.116 and weighted average of 4.7%. Similarly, the statistical analysis conducted on geographies consisting of 336,299,652 people shows a poor positive correlation between the proportion of Jamaicans and unemployment rate among population between the ages 60 and 64 in the United States with a correlation coefficient (R) of 0.162 and weighted average of 5.3%, a difference of 14.2%.
Unemployment Among Ages 60 to 64 years Correlation Summary
| Measurement | Thai | Jamaican |
| Minimum | 1.1% | 1.0% |
| Maximum | 16.5% | 17.9% |
| Range | 15.4% | 16.9% |
| Mean | 4.9% | 5.8% |
| Median | 4.6% | 4.9% |
| Interquartile 25% (IQ1) | 4.0% | 4.2% |
| Interquartile 75% (IQ3) | 5.4% | 6.5% |
| Interquartile Range (IQR) | 1.4% | 2.3% |
| Standard Deviation (Sample) | 2.0% | 3.0% |
| Standard Deviation (Population) | 2.0% | 3.0% |
Similar Demographics by Unemployment Among Ages 60 to 64 years
Demographics Similar to Thais by Unemployment Among Ages 60 to 64 years
In terms of unemployment among ages 60 to 64 years, the demographic groups most similar to Thais are Immigrants from Sri Lanka (4.7%, a difference of 0.0%), Immigrants from Oceania (4.7%, a difference of 0.020%), Immigrants from Jordan (4.7%, a difference of 0.060%), Immigrants from Bulgaria (4.7%, a difference of 0.13%), and Immigrants from Northern Africa (4.7%, a difference of 0.13%).
| Demographics | Rating | Rank | Unemployment Among Ages 60 to 64 years |
| Immigrants | Somalia | 99.2 /100 | #77 | Exceptional 4.6% |
| Seminole | 99.2 /100 | #78 | Exceptional 4.7% |
| Irish | 99.2 /100 | #79 | Exceptional 4.7% |
| Icelanders | 99.1 /100 | #80 | Exceptional 4.7% |
| Iroquois | 99.1 /100 | #81 | Exceptional 4.7% |
| Okinawans | 99.1 /100 | #82 | Exceptional 4.7% |
| Immigrants | Egypt | 99.1 /100 | #83 | Exceptional 4.7% |
| Thais | 98.9 /100 | #84 | Exceptional 4.7% |
| Immigrants | Sri Lanka | 98.9 /100 | #85 | Exceptional 4.7% |
| Immigrants | Oceania | 98.9 /100 | #86 | Exceptional 4.7% |
| Immigrants | Jordan | 98.8 /100 | #87 | Exceptional 4.7% |
| Immigrants | Bulgaria | 98.7 /100 | #88 | Exceptional 4.7% |
| Immigrants | Northern Africa | 98.7 /100 | #89 | Exceptional 4.7% |
| Immigrants | Liberia | 98.7 /100 | #90 | Exceptional 4.7% |
| Immigrants | Uganda | 98.4 /100 | #91 | Exceptional 4.7% |
Demographics Similar to Jamaicans by Unemployment Among Ages 60 to 64 years
In terms of unemployment among ages 60 to 64 years, the demographic groups most similar to Jamaicans are Armenian (5.3%, a difference of 0.12%), Black/African American (5.3%, a difference of 0.15%), Immigrants from Israel (5.3%, a difference of 0.26%), Immigrants from Latin America (5.3%, a difference of 0.28%), and Hispanic or Latino (5.3%, a difference of 0.30%).
| Demographics | Rating | Rank | Unemployment Among Ages 60 to 64 years |
| Spanish Americans | 0.0 /100 | #289 | Tragic 5.3% |
| Immigrants | Trinidad and Tobago | 0.0 /100 | #290 | Tragic 5.3% |
| Hispanics or Latinos | 0.0 /100 | #291 | Tragic 5.3% |
| Immigrants | Latin America | 0.0 /100 | #292 | Tragic 5.3% |
| Immigrants | Israel | 0.0 /100 | #293 | Tragic 5.3% |
| Blacks/African Americans | 0.0 /100 | #294 | Tragic 5.3% |
| Armenians | 0.0 /100 | #295 | Tragic 5.3% |
| Jamaicans | 0.0 /100 | #296 | Tragic 5.3% |
| Osage | 0.0 /100 | #297 | Tragic 5.4% |
| Immigrants | Central America | 0.0 /100 | #298 | Tragic 5.4% |
| Immigrants | El Salvador | 0.0 /100 | #299 | Tragic 5.4% |
| Immigrants | Barbados | 0.0 /100 | #300 | Tragic 5.4% |
| Immigrants | Jamaica | 0.0 /100 | #301 | Tragic 5.4% |
| Barbadians | 0.0 /100 | #302 | Tragic 5.4% |
| Bahamians | 0.0 /100 | #303 | Tragic 5.4% |