Thai vs Immigrants from Sudan Unemployment Among Ages 25 to 29 years
COMPARE
Thai
Immigrants from Sudan
Unemployment Among Ages 25 to 29 years
Unemployment Among Ages 25 to 29 years Comparison
Thais
Immigrants from Sudan
5.9%
UNEMPLOYMENT AMONG AGES 25 TO 29 YEARS
99.9/ 100
METRIC RATING
19th/ 347
METRIC RANK
5.8%
UNEMPLOYMENT AMONG AGES 25 TO 29 YEARS
100.0/ 100
METRIC RATING
10th/ 347
METRIC RANK
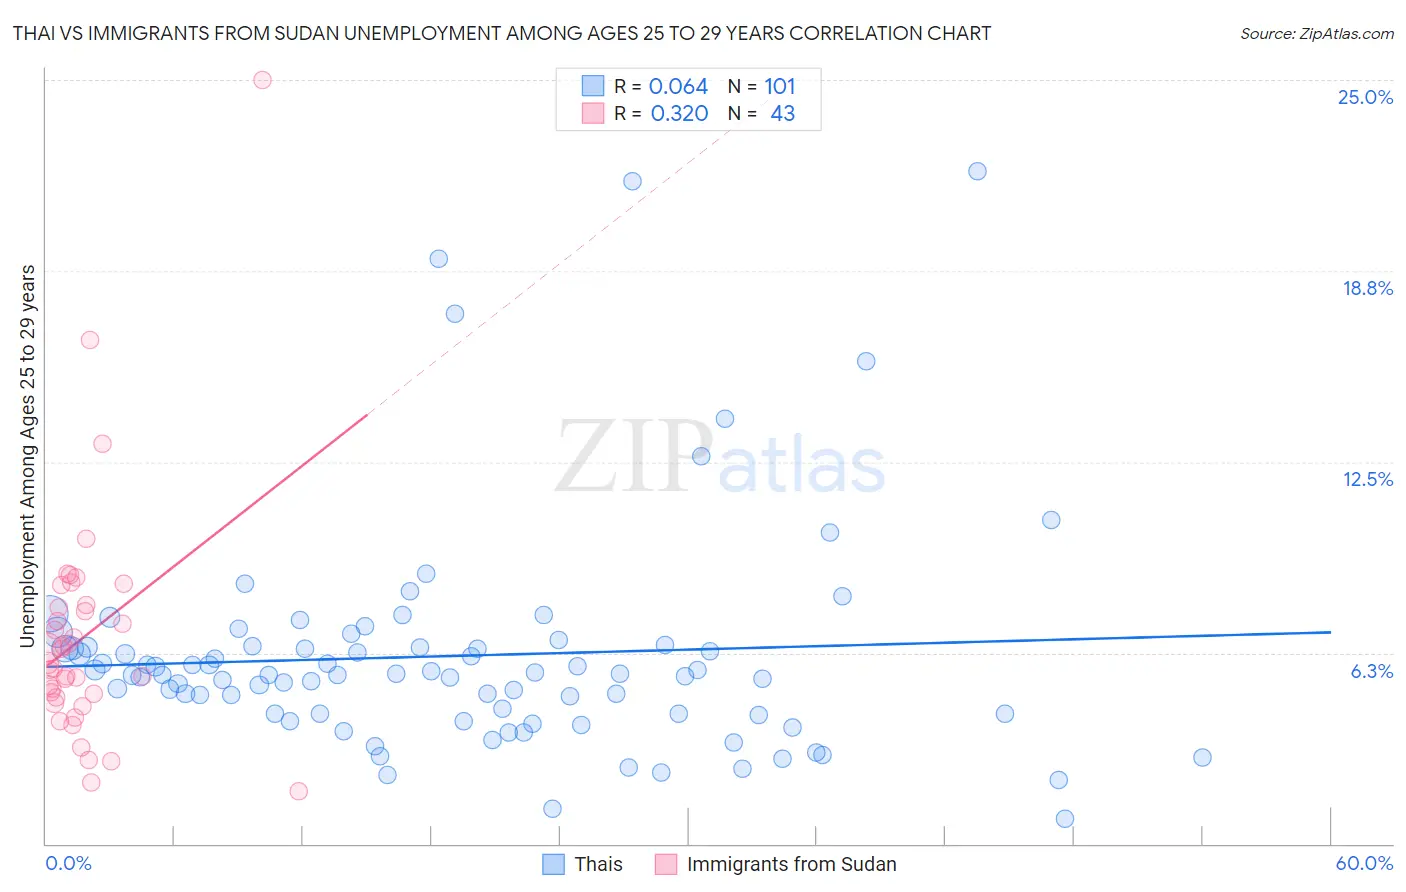
Thai vs Immigrants from Sudan Unemployment Among Ages 25 to 29 years Correlation Chart
The statistical analysis conducted on geographies consisting of 447,521,485 people shows a slight positive correlation between the proportion of Thais and unemployment rate among population between the ages 25 and 29 in the United States with a correlation coefficient (R) of 0.064 and weighted average of 5.9%. Similarly, the statistical analysis conducted on geographies consisting of 117,455,527 people shows a mild positive correlation between the proportion of Immigrants from Sudan and unemployment rate among population between the ages 25 and 29 in the United States with a correlation coefficient (R) of 0.320 and weighted average of 5.8%, a difference of 2.6%.
Unemployment Among Ages 25 to 29 years Correlation Summary
| Measurement | Thai | Immigrants from Sudan |
| Minimum | 0.80% | 1.7% |
| Maximum | 22.0% | 25.0% |
| Range | 21.2% | 23.3% |
| Mean | 6.2% | 6.8% |
| Median | 5.5% | 5.9% |
| Interquartile 25% (IQ1) | 4.3% | 4.8% |
| Interquartile 75% (IQ3) | 6.5% | 7.8% |
| Interquartile Range (IQR) | 2.2% | 3.0% |
| Standard Deviation (Sample) | 3.7% | 3.9% |
| Standard Deviation (Population) | 3.6% | 3.9% |
Demographics Similar to Thais and Immigrants from Sudan by Unemployment Among Ages 25 to 29 years
In terms of unemployment among ages 25 to 29 years, the demographic groups most similar to Thais are Immigrants from Singapore (5.9%, a difference of 0.15%), Immigrants from Eritrea (5.9%, a difference of 0.18%), Bolivian (5.9%, a difference of 0.26%), Immigrants from Bulgaria (5.9%, a difference of 0.40%), and Cuban (5.9%, a difference of 0.41%). Similarly, the demographic groups most similar to Immigrants from Sudan are Immigrants from Nepal (5.7%, a difference of 0.67%), Cambodian (5.8%, a difference of 1.1%), Okinawan (5.9%, a difference of 1.2%), Immigrants from Bolivia (5.9%, a difference of 1.2%), and Immigrants from Kuwait (5.9%, a difference of 1.8%).
| Demographics | Rating | Rank | Unemployment Among Ages 25 to 29 years |
| Immigrants | Cuba | 100.0 /100 | #4 | Exceptional 5.6% |
| Somalis | 100.0 /100 | #5 | Exceptional 5.6% |
| Hmong | 100.0 /100 | #6 | Exceptional 5.7% |
| Immigrants | India | 100.0 /100 | #7 | Exceptional 5.7% |
| Immigrants | Bosnia and Herzegovina | 100.0 /100 | #8 | Exceptional 5.7% |
| Immigrants | Nepal | 100.0 /100 | #9 | Exceptional 5.7% |
| Immigrants | Sudan | 100.0 /100 | #10 | Exceptional 5.8% |
| Cambodians | 100.0 /100 | #11 | Exceptional 5.8% |
| Okinawans | 100.0 /100 | #12 | Exceptional 5.9% |
| Immigrants | Bolivia | 100.0 /100 | #13 | Exceptional 5.9% |
| Immigrants | Kuwait | 99.9 /100 | #14 | Exceptional 5.9% |
| Cubans | 99.9 /100 | #15 | Exceptional 5.9% |
| Immigrants | Bulgaria | 99.9 /100 | #16 | Exceptional 5.9% |
| Bolivians | 99.9 /100 | #17 | Exceptional 5.9% |
| Immigrants | Singapore | 99.9 /100 | #18 | Exceptional 5.9% |
| Thais | 99.9 /100 | #19 | Exceptional 5.9% |
| Immigrants | Eritrea | 99.9 /100 | #20 | Exceptional 5.9% |
| Immigrants | Ethiopia | 99.9 /100 | #21 | Exceptional 6.0% |
| Immigrants | Japan | 99.9 /100 | #22 | Exceptional 6.0% |
| Immigrants | Venezuela | 99.8 /100 | #23 | Exceptional 6.0% |
| Norwegians | 99.8 /100 | #24 | Exceptional 6.0% |