Thai vs Cree Unemployment Among Ages 35 to 44 years
COMPARE
Thai
Cree
Unemployment Among Ages 35 to 44 years
Unemployment Among Ages 35 to 44 years Comparison
Thais
Cree
3.9%
UNEMPLOYMENT AMONG AGES 35 TO 44 YEARS
100.0/ 100
METRIC RATING
2nd/ 347
METRIC RANK
5.5%
UNEMPLOYMENT AMONG AGES 35 TO 44 YEARS
0.0/ 100
METRIC RATING
288th/ 347
METRIC RANK
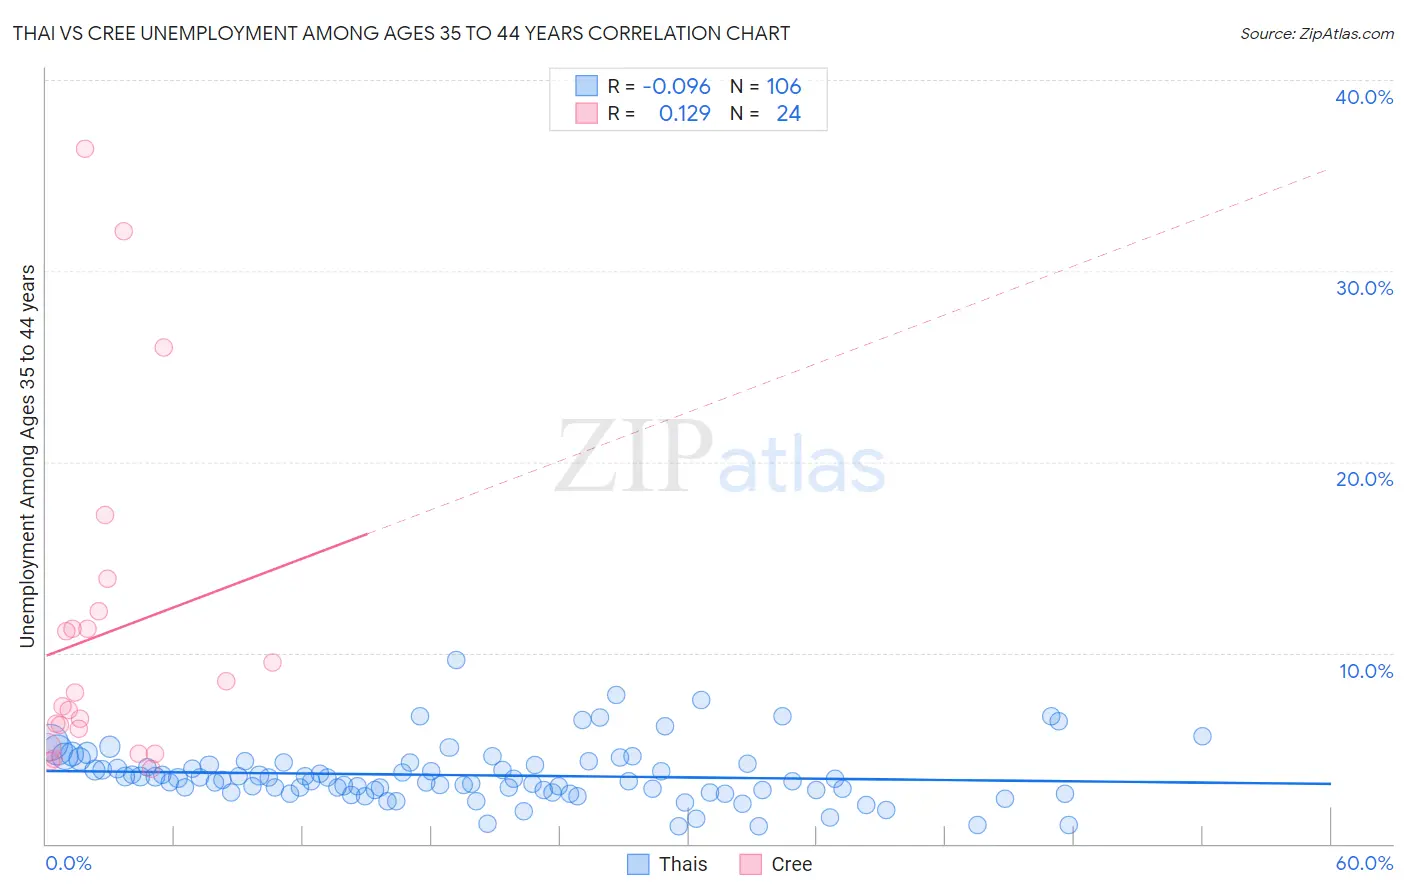
Thai vs Cree Unemployment Among Ages 35 to 44 years Correlation Chart
The statistical analysis conducted on geographies consisting of 461,302,487 people shows a slight negative correlation between the proportion of Thais and unemployment rate among population between the ages 35 and 44 in the United States with a correlation coefficient (R) of -0.096 and weighted average of 3.9%. Similarly, the statistical analysis conducted on geographies consisting of 75,629,723 people shows a poor positive correlation between the proportion of Cree and unemployment rate among population between the ages 35 and 44 in the United States with a correlation coefficient (R) of 0.129 and weighted average of 5.5%, a difference of 39.8%.
Unemployment Among Ages 35 to 44 years Correlation Summary
| Measurement | Thai | Cree |
| Minimum | 0.90% | 3.9% |
| Maximum | 9.7% | 36.4% |
| Range | 8.8% | 32.5% |
| Mean | 3.6% | 11.0% |
| Median | 3.4% | 7.5% |
| Interquartile 25% (IQ1) | 2.8% | 5.5% |
| Interquartile 75% (IQ3) | 4.2% | 11.7% |
| Interquartile Range (IQR) | 1.4% | 6.2% |
| Standard Deviation (Sample) | 1.5% | 8.7% |
| Standard Deviation (Population) | 1.5% | 8.6% |
Similar Demographics by Unemployment Among Ages 35 to 44 years
Demographics Similar to Thais by Unemployment Among Ages 35 to 44 years
In terms of unemployment among ages 35 to 44 years, the demographic groups most similar to Thais are Norwegian (4.0%, a difference of 1.4%), Immigrants from Taiwan (4.0%, a difference of 1.9%), Filipino (4.0%, a difference of 2.6%), Immigrants from Venezuela (4.0%, a difference of 2.7%), and Immigrants from Cuba (4.1%, a difference of 3.5%).
| Demographics | Rating | Rank | Unemployment Among Ages 35 to 44 years |
| Immigrants | India | 100.0 /100 | #1 | Exceptional 3.8% |
| Thais | 100.0 /100 | #2 | Exceptional 3.9% |
| Norwegians | 100.0 /100 | #3 | Exceptional 4.0% |
| Immigrants | Taiwan | 100.0 /100 | #4 | Exceptional 4.0% |
| Filipinos | 100.0 /100 | #5 | Exceptional 4.0% |
| Immigrants | Venezuela | 100.0 /100 | #6 | Exceptional 4.0% |
| Immigrants | Cuba | 99.9 /100 | #7 | Exceptional 4.1% |
| Immigrants | South Central Asia | 99.9 /100 | #8 | Exceptional 4.1% |
| Danes | 99.9 /100 | #9 | Exceptional 4.1% |
| Immigrants | Singapore | 99.9 /100 | #10 | Exceptional 4.1% |
| Sudanese | 99.9 /100 | #11 | Exceptional 4.1% |
| Venezuelans | 99.9 /100 | #12 | Exceptional 4.1% |
| Bolivians | 99.9 /100 | #13 | Exceptional 4.1% |
| Czechs | 99.9 /100 | #14 | Exceptional 4.1% |
| Tongans | 99.8 /100 | #15 | Exceptional 4.2% |
Demographics Similar to Cree by Unemployment Among Ages 35 to 44 years
In terms of unemployment among ages 35 to 44 years, the demographic groups most similar to Cree are French American Indian (5.5%, a difference of 0.16%), Immigrants from Micronesia (5.5%, a difference of 0.28%), Spanish American Indian (5.5%, a difference of 0.34%), Hispanic or Latino (5.5%, a difference of 0.40%), and Jamaican (5.5%, a difference of 0.42%).
| Demographics | Rating | Rank | Unemployment Among Ages 35 to 44 years |
| Immigrants | Portugal | 0.0 /100 | #281 | Tragic 5.4% |
| Immigrants | Ghana | 0.0 /100 | #282 | Tragic 5.4% |
| Immigrants | Ecuador | 0.0 /100 | #283 | Tragic 5.4% |
| Haitians | 0.0 /100 | #284 | Tragic 5.5% |
| Hispanics or Latinos | 0.0 /100 | #285 | Tragic 5.5% |
| Immigrants | Micronesia | 0.0 /100 | #286 | Tragic 5.5% |
| French American Indians | 0.0 /100 | #287 | Tragic 5.5% |
| Cree | 0.0 /100 | #288 | Tragic 5.5% |
| Spanish American Indians | 0.0 /100 | #289 | Tragic 5.5% |
| Jamaicans | 0.0 /100 | #290 | Tragic 5.5% |
| Dutch West Indians | 0.0 /100 | #291 | Tragic 5.5% |
| Immigrants | Haiti | 0.0 /100 | #292 | Tragic 5.5% |
| Central American Indians | 0.0 /100 | #293 | Tragic 5.6% |
| Trinidadians and Tobagonians | 0.0 /100 | #294 | Tragic 5.6% |
| Ottawa | 0.0 /100 | #295 | Tragic 5.6% |