Taiwanese vs Comanche Unemployment Among Ages 16 to 19 years
COMPARE
Taiwanese
Comanche
Unemployment Among Ages 16 to 19 years
Unemployment Among Ages 16 to 19 years Comparison
Taiwanese
Comanche
15.5%
UNEMPLOYMENT AMONG AGES 16 TO 19 YEARS
100.0/ 100
METRIC RATING
12th/ 347
METRIC RANK
20.2%
UNEMPLOYMENT AMONG AGES 16 TO 19 YEARS
0.0/ 100
METRIC RATING
292nd/ 347
METRIC RANK
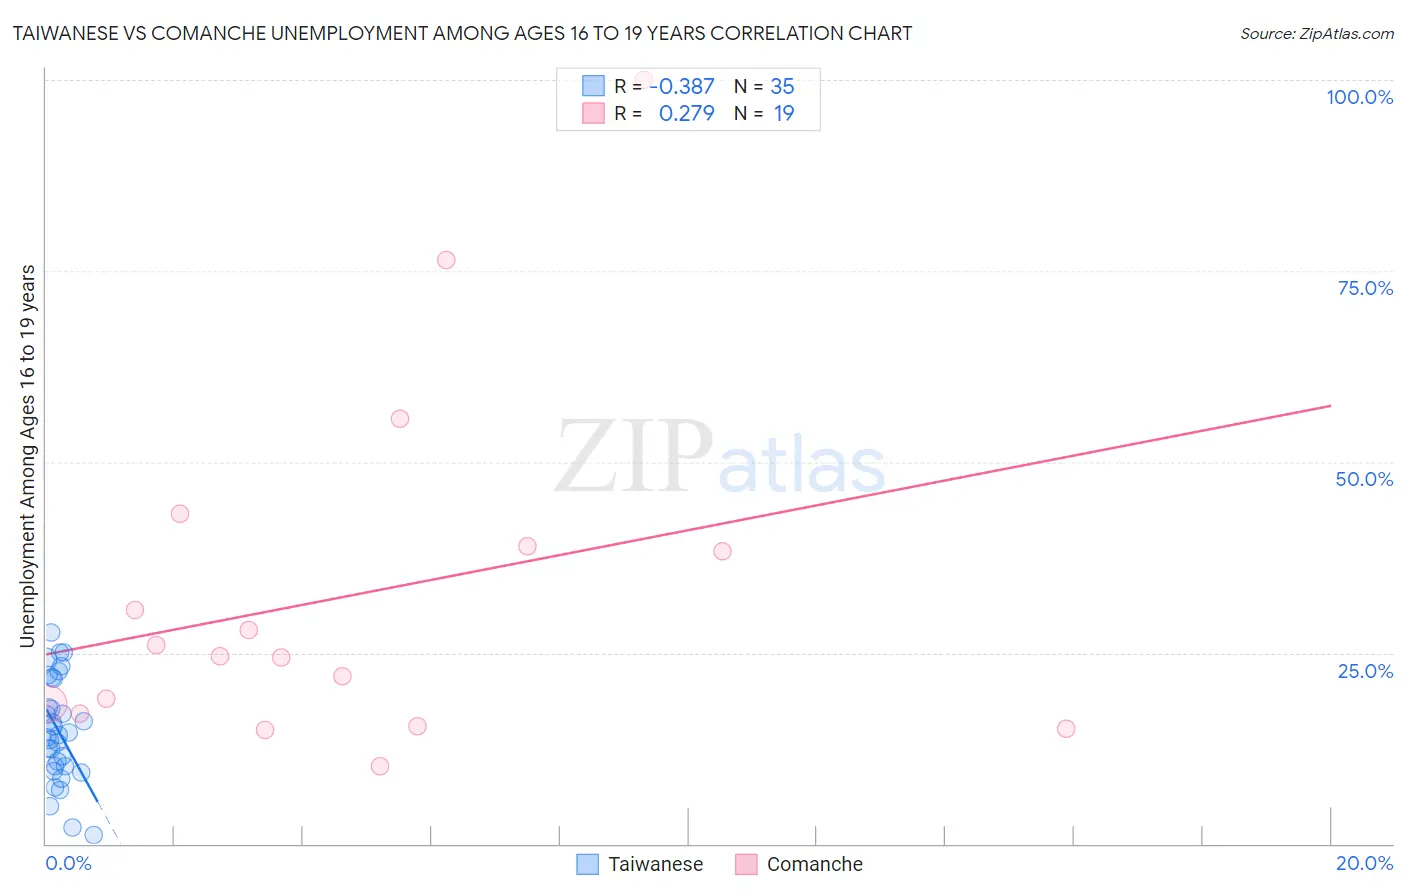
Taiwanese vs Comanche Unemployment Among Ages 16 to 19 years Correlation Chart
The statistical analysis conducted on geographies consisting of 31,481,670 people shows a mild negative correlation between the proportion of Taiwanese and unemployment rate among population between the ages 16 and 19 in the United States with a correlation coefficient (R) of -0.387 and weighted average of 15.5%. Similarly, the statistical analysis conducted on geographies consisting of 107,292,450 people shows a weak positive correlation between the proportion of Comanche and unemployment rate among population between the ages 16 and 19 in the United States with a correlation coefficient (R) of 0.279 and weighted average of 20.2%, a difference of 30.4%.
Unemployment Among Ages 16 to 19 years Correlation Summary
| Measurement | Taiwanese | Comanche |
| Minimum | 1.1% | 10.1% |
| Maximum | 27.6% | 100.0% |
| Range | 26.5% | 89.9% |
| Mean | 14.8% | 32.5% |
| Median | 14.2% | 24.6% |
| Interquartile 25% (IQ1) | 10.1% | 17.0% |
| Interquartile 75% (IQ3) | 21.7% | 38.9% |
| Interquartile Range (IQR) | 11.6% | 21.9% |
| Standard Deviation (Sample) | 6.7% | 23.0% |
| Standard Deviation (Population) | 6.6% | 22.4% |
Similar Demographics by Unemployment Among Ages 16 to 19 years
Demographics Similar to Taiwanese by Unemployment Among Ages 16 to 19 years
In terms of unemployment among ages 16 to 19 years, the demographic groups most similar to Taiwanese are Indonesian (15.5%, a difference of 0.10%), Immigrants from Burma/Myanmar (15.6%, a difference of 0.43%), Zimbabwean (15.4%, a difference of 0.52%), Immigrants from Zaire (15.6%, a difference of 0.58%), and Scandinavian (15.4%, a difference of 0.63%).
| Demographics | Rating | Rank | Unemployment Among Ages 16 to 19 years |
| Immigrants | Somalia | 100.0 /100 | #5 | Exceptional 15.3% |
| Swedes | 100.0 /100 | #6 | Exceptional 15.3% |
| Immigrants | Bosnia and Herzegovina | 100.0 /100 | #7 | Exceptional 15.3% |
| Czechs | 100.0 /100 | #8 | Exceptional 15.4% |
| Scandinavians | 100.0 /100 | #9 | Exceptional 15.4% |
| Zimbabweans | 100.0 /100 | #10 | Exceptional 15.4% |
| Indonesians | 100.0 /100 | #11 | Exceptional 15.5% |
| Taiwanese | 100.0 /100 | #12 | Exceptional 15.5% |
| Immigrants | Burma/Myanmar | 100.0 /100 | #13 | Exceptional 15.6% |
| Immigrants | Zaire | 100.0 /100 | #14 | Exceptional 15.6% |
| Yugoslavians | 100.0 /100 | #15 | Exceptional 15.6% |
| Germans | 100.0 /100 | #16 | Exceptional 15.7% |
| Somalis | 100.0 /100 | #17 | Exceptional 15.7% |
| Thais | 100.0 /100 | #18 | Exceptional 15.7% |
| Swiss | 100.0 /100 | #19 | Exceptional 15.8% |
Demographics Similar to Comanche by Unemployment Among Ages 16 to 19 years
In terms of unemployment among ages 16 to 19 years, the demographic groups most similar to Comanche are Immigrants from Bahamas (20.4%, a difference of 0.63%), Immigrants from Haiti (20.4%, a difference of 0.89%), Central American Indian (20.4%, a difference of 0.94%), Immigrants from Yemen (20.0%, a difference of 1.0%), and Armenian (20.5%, a difference of 1.2%).
| Demographics | Rating | Rank | Unemployment Among Ages 16 to 19 years |
| Ghanaians | 0.0 /100 | #285 | Tragic 19.8% |
| Bahamians | 0.0 /100 | #286 | Tragic 19.8% |
| Immigrants | Ghana | 0.0 /100 | #287 | Tragic 19.8% |
| Immigrants | Azores | 0.0 /100 | #288 | Tragic 19.8% |
| Pueblo | 0.0 /100 | #289 | Tragic 19.8% |
| Immigrants | Sierra Leone | 0.0 /100 | #290 | Tragic 20.0% |
| Immigrants | Yemen | 0.0 /100 | #291 | Tragic 20.0% |
| Comanche | 0.0 /100 | #292 | Tragic 20.2% |
| Immigrants | Bahamas | 0.0 /100 | #293 | Tragic 20.4% |
| Immigrants | Haiti | 0.0 /100 | #294 | Tragic 20.4% |
| Central American Indians | 0.0 /100 | #295 | Tragic 20.4% |
| Armenians | 0.0 /100 | #296 | Tragic 20.5% |
| Alsatians | 0.0 /100 | #297 | Tragic 20.5% |
| Haitians | 0.0 /100 | #298 | Tragic 20.5% |
| Immigrants | Uzbekistan | 0.0 /100 | #299 | Tragic 20.5% |