Taiwanese vs Armenian Unemployment Among Ages 35 to 44 years
COMPARE
Taiwanese
Armenian
Unemployment Among Ages 35 to 44 years
Unemployment Among Ages 35 to 44 years Comparison
Taiwanese
Armenians
4.4%
UNEMPLOYMENT AMONG AGES 35 TO 44 YEARS
97.1/ 100
METRIC RATING
60th/ 347
METRIC RANK
5.2%
UNEMPLOYMENT AMONG AGES 35 TO 44 YEARS
0.2/ 100
METRIC RATING
252nd/ 347
METRIC RANK
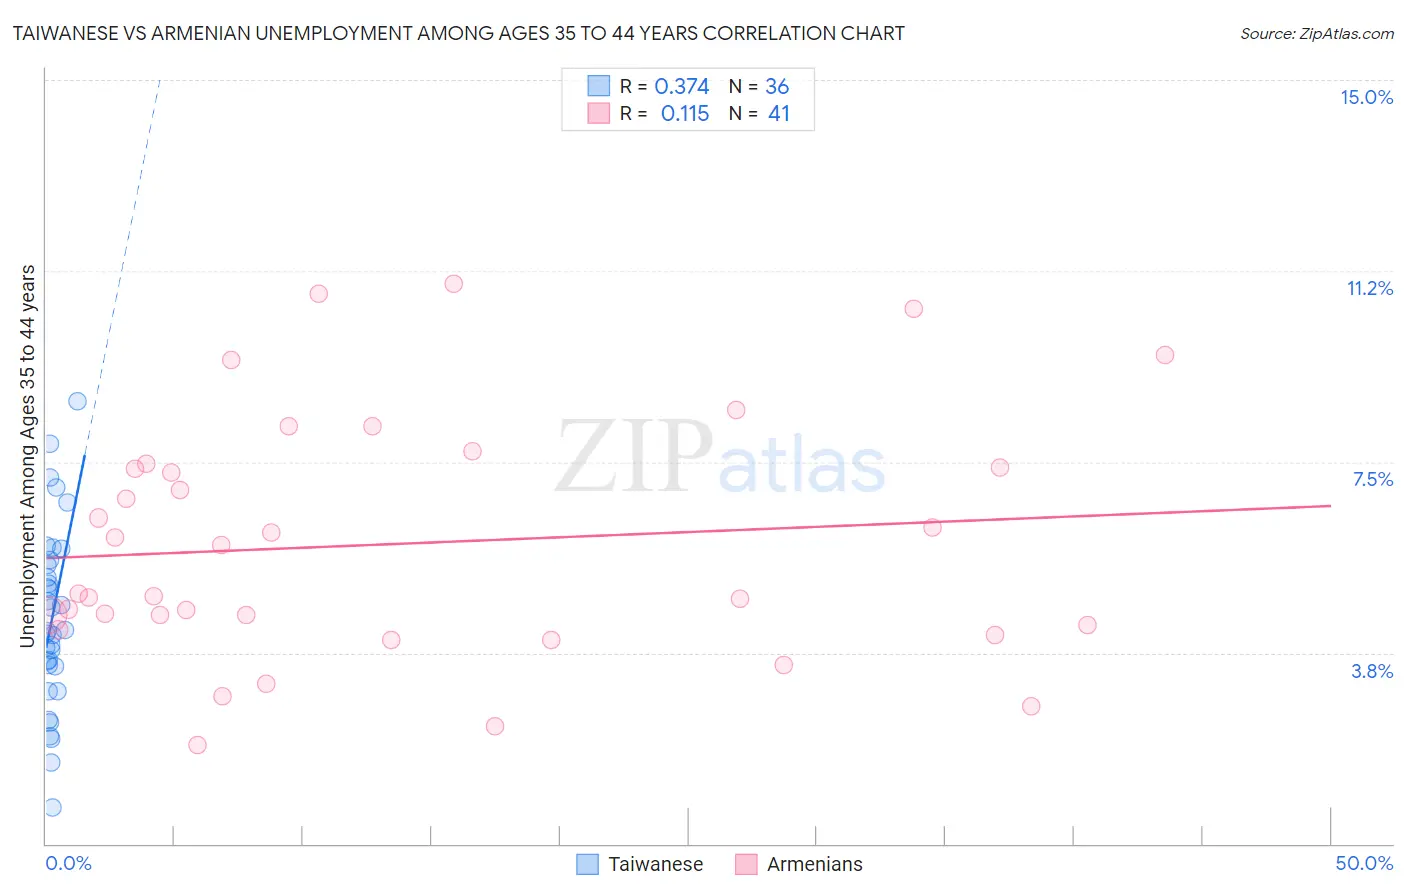
Taiwanese vs Armenian Unemployment Among Ages 35 to 44 years Correlation Chart
The statistical analysis conducted on geographies consisting of 31,618,542 people shows a mild positive correlation between the proportion of Taiwanese and unemployment rate among population between the ages 35 and 44 in the United States with a correlation coefficient (R) of 0.374 and weighted average of 4.4%. Similarly, the statistical analysis conducted on geographies consisting of 305,385,714 people shows a poor positive correlation between the proportion of Armenians and unemployment rate among population between the ages 35 and 44 in the United States with a correlation coefficient (R) of 0.115 and weighted average of 5.2%, a difference of 18.7%.
Unemployment Among Ages 35 to 44 years Correlation Summary
| Measurement | Taiwanese | Armenian |
| Minimum | 0.70% | 1.9% |
| Maximum | 8.7% | 11.0% |
| Range | 8.0% | 9.1% |
| Mean | 4.4% | 5.9% |
| Median | 4.2% | 4.9% |
| Interquartile 25% (IQ1) | 3.5% | 4.2% |
| Interquartile 75% (IQ3) | 5.5% | 7.4% |
| Interquartile Range (IQR) | 2.0% | 3.2% |
| Standard Deviation (Sample) | 1.8% | 2.4% |
| Standard Deviation (Population) | 1.7% | 2.3% |
Similar Demographics by Unemployment Among Ages 35 to 44 years
Demographics Similar to Taiwanese by Unemployment Among Ages 35 to 44 years
In terms of unemployment among ages 35 to 44 years, the demographic groups most similar to Taiwanese are Croatian (4.4%, a difference of 0.010%), Immigrants from Bulgaria (4.4%, a difference of 0.010%), Austrian (4.4%, a difference of 0.020%), Greek (4.4%, a difference of 0.030%), and English (4.4%, a difference of 0.040%).
| Demographics | Rating | Rank | Unemployment Among Ages 35 to 44 years |
| Immigrants | Argentina | 97.6 /100 | #53 | Exceptional 4.4% |
| Asians | 97.4 /100 | #54 | Exceptional 4.4% |
| Immigrants | Moldova | 97.3 /100 | #55 | Exceptional 4.4% |
| Chileans | 97.3 /100 | #56 | Exceptional 4.4% |
| Immigrants | Hong Kong | 97.2 /100 | #57 | Exceptional 4.4% |
| English | 97.2 /100 | #58 | Exceptional 4.4% |
| Greeks | 97.1 /100 | #59 | Exceptional 4.4% |
| Taiwanese | 97.1 /100 | #60 | Exceptional 4.4% |
| Croatians | 97.1 /100 | #61 | Exceptional 4.4% |
| Immigrants | Bulgaria | 97.1 /100 | #62 | Exceptional 4.4% |
| Austrians | 97.1 /100 | #63 | Exceptional 4.4% |
| Immigrants | Serbia | 97.0 /100 | #64 | Exceptional 4.4% |
| Cambodians | 97.0 /100 | #65 | Exceptional 4.4% |
| Icelanders | 96.8 /100 | #66 | Exceptional 4.4% |
| Argentineans | 96.8 /100 | #67 | Exceptional 4.4% |
Demographics Similar to Armenians by Unemployment Among Ages 35 to 44 years
In terms of unemployment among ages 35 to 44 years, the demographic groups most similar to Armenians are Mexican American Indian (5.2%, a difference of 0.020%), Immigrants from Bahamas (5.2%, a difference of 0.050%), Cherokee (5.2%, a difference of 0.10%), Comanche (5.2%, a difference of 0.13%), and Seminole (5.2%, a difference of 0.36%).
| Demographics | Rating | Rank | Unemployment Among Ages 35 to 44 years |
| Bahamians | 0.4 /100 | #245 | Tragic 5.2% |
| Immigrants | Guatemala | 0.4 /100 | #246 | Tragic 5.2% |
| Immigrants | Somalia | 0.3 /100 | #247 | Tragic 5.2% |
| Alsatians | 0.2 /100 | #248 | Tragic 5.2% |
| Immigrants | Liberia | 0.2 /100 | #249 | Tragic 5.2% |
| Immigrants | El Salvador | 0.2 /100 | #250 | Tragic 5.2% |
| Comanche | 0.2 /100 | #251 | Tragic 5.2% |
| Armenians | 0.2 /100 | #252 | Tragic 5.2% |
| Mexican American Indians | 0.2 /100 | #253 | Tragic 5.2% |
| Immigrants | Bahamas | 0.2 /100 | #254 | Tragic 5.2% |
| Cherokee | 0.2 /100 | #255 | Tragic 5.2% |
| Seminole | 0.1 /100 | #256 | Tragic 5.2% |
| Immigrants | Fiji | 0.1 /100 | #257 | Tragic 5.3% |
| Immigrants | Latin America | 0.1 /100 | #258 | Tragic 5.3% |
| Mexicans | 0.1 /100 | #259 | Tragic 5.3% |