Syrian vs Immigrants from Ethiopia Unemployment Among Youth under 25 years
COMPARE
Syrian
Immigrants from Ethiopia
Unemployment Among Youth under 25 years
Unemployment Among Youth under 25 years Comparison
Syrians
Immigrants from Ethiopia
11.7%
UNEMPLOYMENT AMONG YOUTH UNDER 25 YEARS
38.4/ 100
METRIC RATING
181st/ 347
METRIC RANK
11.3%
UNEMPLOYMENT AMONG YOUTH UNDER 25 YEARS
89.9/ 100
METRIC RATING
114th/ 347
METRIC RANK
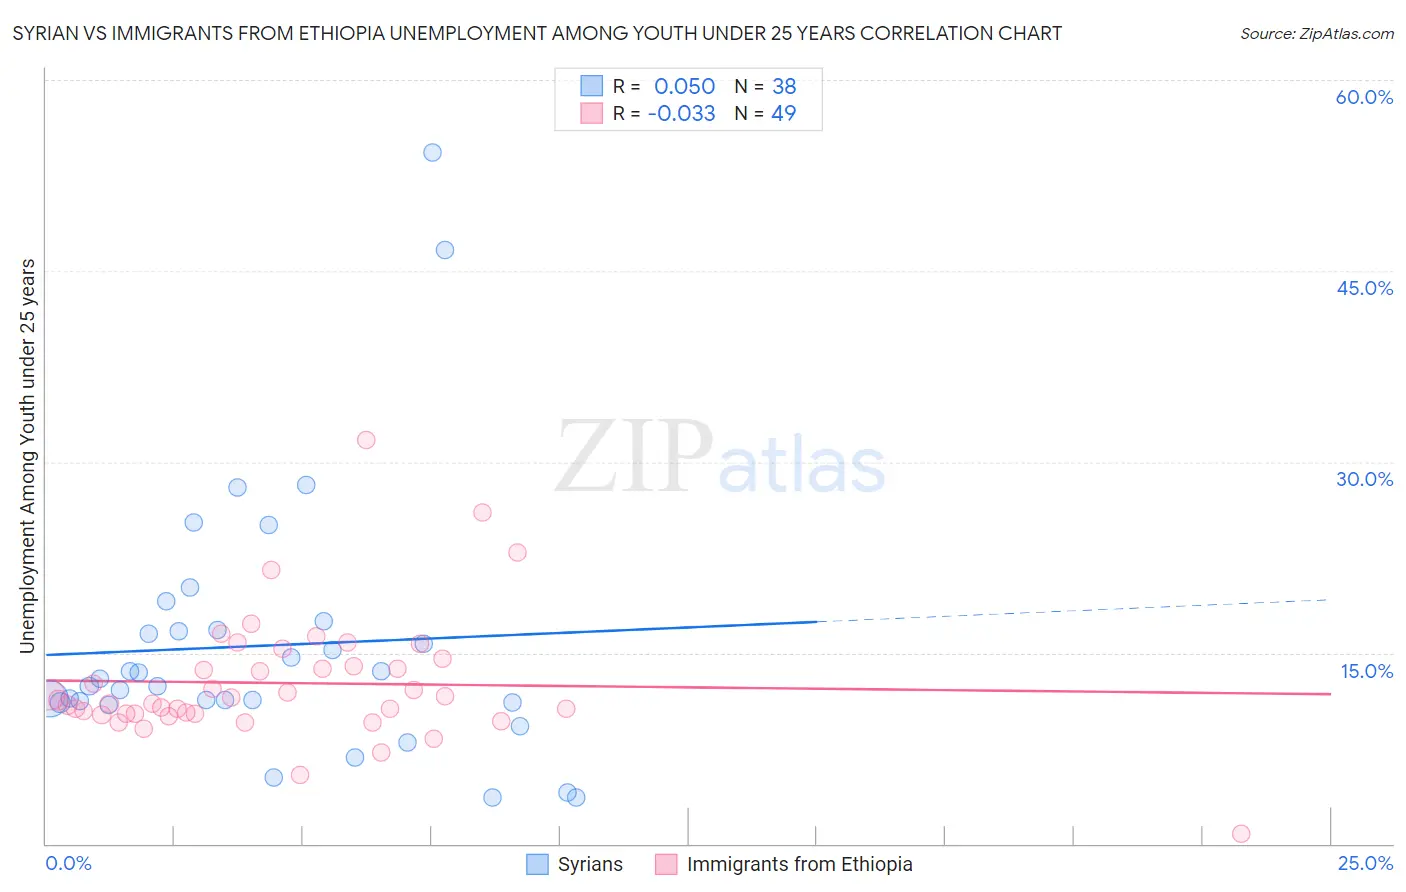
Syrian vs Immigrants from Ethiopia Unemployment Among Youth under 25 years Correlation Chart
The statistical analysis conducted on geographies consisting of 264,359,059 people shows a slight positive correlation between the proportion of Syrians and unemployment rate among youth under the age of 25 in the United States with a correlation coefficient (R) of 0.050 and weighted average of 11.7%. Similarly, the statistical analysis conducted on geographies consisting of 210,737,565 people shows no correlation between the proportion of Immigrants from Ethiopia and unemployment rate among youth under the age of 25 in the United States with a correlation coefficient (R) of -0.033 and weighted average of 11.3%, a difference of 2.8%.
Unemployment Among Youth under 25 years Correlation Summary
| Measurement | Syrian | Immigrants from Ethiopia |
| Minimum | 3.6% | 0.80% |
| Maximum | 54.3% | 31.7% |
| Range | 50.7% | 30.9% |
| Mean | 15.6% | 12.6% |
| Median | 12.7% | 11.3% |
| Interquartile 25% (IQ1) | 11.1% | 10.2% |
| Interquartile 75% (IQ3) | 16.8% | 14.2% |
| Interquartile Range (IQR) | 5.7% | 4.0% |
| Standard Deviation (Sample) | 10.3% | 5.0% |
| Standard Deviation (Population) | 10.2% | 4.9% |
Similar Demographics by Unemployment Among Youth under 25 years
Demographics Similar to Syrians by Unemployment Among Youth under 25 years
In terms of unemployment among youth under 25 years, the demographic groups most similar to Syrians are Spaniard (11.7%, a difference of 0.060%), Immigrants from Italy (11.7%, a difference of 0.10%), Immigrants from Europe (11.6%, a difference of 0.17%), Immigrants from Hong Kong (11.6%, a difference of 0.17%), and American (11.7%, a difference of 0.18%).
| Demographics | Rating | Rank | Unemployment Among Youth under 25 years |
| Immigrants | China | 50.0 /100 | #174 | Average 11.6% |
| Immigrants | Iraq | 47.0 /100 | #175 | Average 11.6% |
| Ugandans | 45.6 /100 | #176 | Average 11.6% |
| Immigrants | Denmark | 45.0 /100 | #177 | Average 11.6% |
| Immigrants | Europe | 42.4 /100 | #178 | Average 11.6% |
| Immigrants | Hong Kong | 42.4 /100 | #179 | Average 11.6% |
| Spaniards | 39.8 /100 | #180 | Fair 11.7% |
| Syrians | 38.4 /100 | #181 | Fair 11.7% |
| Immigrants | Italy | 36.2 /100 | #182 | Fair 11.7% |
| Americans | 34.5 /100 | #183 | Fair 11.7% |
| Immigrants | Eastern Europe | 34.1 /100 | #184 | Fair 11.7% |
| French American Indians | 34.0 /100 | #185 | Fair 11.7% |
| Maltese | 33.9 /100 | #186 | Fair 11.7% |
| Immigrants | Egypt | 31.9 /100 | #187 | Fair 11.7% |
| Immigrants | Poland | 31.4 /100 | #188 | Fair 11.7% |
Demographics Similar to Immigrants from Ethiopia by Unemployment Among Youth under 25 years
In terms of unemployment among youth under 25 years, the demographic groups most similar to Immigrants from Ethiopia are Immigrants from Vietnam (11.3%, a difference of 0.010%), Burmese (11.3%, a difference of 0.020%), Sri Lankan (11.3%, a difference of 0.020%), Afghan (11.3%, a difference of 0.030%), and Immigrants from France (11.3%, a difference of 0.040%).
| Demographics | Rating | Rank | Unemployment Among Youth under 25 years |
| Immigrants | Lithuania | 92.9 /100 | #107 | Exceptional 11.3% |
| Immigrants | Kuwait | 92.9 /100 | #108 | Exceptional 11.3% |
| Iranians | 92.0 /100 | #109 | Exceptional 11.3% |
| Immigrants | Norway | 91.5 /100 | #110 | Exceptional 11.3% |
| Immigrants | France | 90.3 /100 | #111 | Exceptional 11.3% |
| Immigrants | Austria | 90.3 /100 | #112 | Exceptional 11.3% |
| Fijians | 90.2 /100 | #113 | Exceptional 11.3% |
| Immigrants | Ethiopia | 89.9 /100 | #114 | Excellent 11.3% |
| Immigrants | Vietnam | 89.9 /100 | #115 | Excellent 11.3% |
| Burmese | 89.8 /100 | #116 | Excellent 11.3% |
| Sri Lankans | 89.8 /100 | #117 | Excellent 11.3% |
| Afghans | 89.7 /100 | #118 | Excellent 11.3% |
| Immigrants | Scotland | 89.2 /100 | #119 | Excellent 11.4% |
| Malaysians | 89.0 /100 | #120 | Excellent 11.4% |
| Slovaks | 88.9 /100 | #121 | Excellent 11.4% |