Syrian vs Cheyenne Unemployment Among Ages 20 to 24 years

COMPARE

Syrian
Race
Ancestry
AfghanAfricanAlaska NativeAlaskan AthabascanAlbanianAleutAlsatianAmericanApacheArabArapahoArgentineanArmenianAssyrian/Chaldean/SyriacAustralianAustrianBahamianBangladeshiBarbadianBasqueBelgianBelizeanBermudanBhutaneseBlackfeetBolivianBrazilianBritishBritish West IndianBulgarianBurmeseCajunCambodianCanadianCape VerdeanCarpatho RusynCelticCentral AmericanCentral American IndianCherokeeChickasawChileanChineseChippewaChoctawColombianColvilleComancheCosta RicanCreeCreekCroatianCrowCubanCypriotCzechCzechoslovakianDanishDelawareDominicanDutchDutch West IndianEastern EuropeanEcuadorianEgyptianEnglishEstonianEthiopianEuropeanFijianFilipinoFinnishFrenchFrench American IndianFrench CanadianGermanGerman RussianGhanaianGreekGuamanian/ChamorroGuatemalanGuyaneseHaitianHmongHonduranHopiHoumaHungarianIcelanderIndian (Asian)IndonesianInupiatIranianIraqiIrishIroquoisIsraeliItalianJamaicanJapaneseJordanianKenyanKiowaKoreanLaotianLatvianLebaneseLiberianLithuanianLumbeeLuxembourgerMacedonianMalaysianMalteseMarshalleseMenomineeMexicanMexican American IndianMongolianMoroccanNative HawaiianNavajoNepaleseNew ZealanderNicaraguanNigerianNorthern EuropeanNorwegianOkinawanOsageOttawaPaiutePakistaniPalestinianPanamanianParaguayanPennsylvania GermanPeruvianPimaPolishPortuguesePotawatomiPuebloPuerto RicanPuget Sound SalishRomanianRussianSalvadoranSamoanScandinavianScotch-IrishScottishSeminoleSenegaleseSerbianShoshoneSierra LeoneanSiouxSlavicSlovakSloveneSomaliSouth AfricanSouth AmericanSouth American IndianSoviet UnionSpaniardSpanishSpanish AmericanSpanish American IndianSri LankanSubsaharan AfricanSudaneseSwedishSwissSyrianTaiwaneseThaiTlingit-HaidaTohono O'OdhamTonganTrinidadian and TobagonianTsimshianTurkishU.S. Virgin IslanderUgandanUkrainianUruguayanUteVenezuelanVietnameseWelshWest IndianYakamaYaquiYugoslavianYumanYup'ikZimbabwean
Immigration
NonimmigrantsImmigrantsAfghanistanAfricaAlbaniaArgentinaArmeniaAsiaAustraliaAustriaBahamasBangladeshBarbadosBelarusBelgiumBelizeBoliviaBosnia and HerzegovinaBrazilBulgariaBurma/MyanmarCabo VerdeCambodiaCameroonCanadaCaribbeanCentral AmericaChileChinaColombiaCongoCosta RicaCroatiaCubaCzechoslovakiaDenmarkDominicaDominican RepublicEastern AfricaEastern AsiaEastern EuropeEcuadorEgyptEl SalvadorEnglandEritreaEthiopiaEuropeFijiFranceGermanyGhanaGreeceGrenadaGuatemalaGuyanaHaitiHondurasHong KongHungaryIndiaIndonesiaIranIraqIrelandIsraelItalyJamaicaJapanJordanKazakhstanKenyaKoreaKuwaitLaosLatin AmericaLatviaLebanonLiberiaLithuaniaMalaysiaMexicoMicronesiaMiddle AfricaMoldovaMoroccoNepalNetherlandsNicaraguaNigeriaNorth AmericaNorth MacedoniaNorthern AfricaNorthern EuropeNorwayOceaniaPakistanPanamaPeruPhilippinesPolandPortugalRomaniaRussiaSaudi ArabiaScotlandSenegalSerbiaSierra LeoneSingaporeSomaliaSouth AfricaSouth AmericaSouth Central AsiaSouth Eastern AsiaSouthern EuropeSpainSri LankaSt. Vincent and the GrenadinesSudanSwedenSwitzerlandSyriaTaiwanThailandTrinidad and TobagoTurkeyUgandaUkraineUruguayUzbekistanVenezuelaVietnamWest IndiesWestern AfricaWestern AsiaWestern EuropeYemenZaireZimbabweAzores
Cheyenne
Race
Ancestry
AfghanAfricanAlaska NativeAlaskan AthabascanAlbanianAleutAlsatianAmericanApacheArabArapahoArgentineanArmenianAssyrian/Chaldean/SyriacAustralianAustrianBahamianBangladeshiBarbadianBasqueBelgianBelizeanBermudanBhutaneseBlackfeetBolivianBrazilianBritishBritish West IndianBulgarianBurmeseCajunCambodianCanadianCape VerdeanCarpatho RusynCelticCentral AmericanCentral American IndianCherokeeCheyenneChickasawChileanChineseChippewaChoctawColombianColvilleComancheCosta RicanCreeCreekCroatianCrowCubanCypriotCzechCzechoslovakianDanishDelawareDominicanDutchDutch West IndianEastern EuropeanEcuadorianEgyptianEnglishEstonianEthiopianEuropeanFijianFilipinoFinnishFrenchFrench American IndianFrench CanadianGermanGerman RussianGhanaianGreekGuamanian/ChamorroGuatemalanGuyaneseHaitianHmongHonduranHopiHoumaHungarianIcelanderIndian (Asian)IndonesianInupiatIranianIraqiIrishIroquoisIsraeliItalianJamaicanJapaneseJordanianKenyanKiowaKoreanLaotianLatvianLebaneseLiberianLithuanianLumbeeLuxembourgerMacedonianMalaysianMalteseMarshalleseMenomineeMexicanMexican American IndianMongolianMoroccanNative HawaiianNavajoNepaleseNew ZealanderNicaraguanNigerianNorthern EuropeanNorwegianOkinawanOsageOttawaPaiutePakistaniPalestinianPanamanianParaguayanPennsylvania GermanPeruvianPimaPolishPortuguesePotawatomiPuebloPuerto RicanPuget Sound SalishRomanianRussianSalvadoranSamoanScandinavianScotch-IrishScottishSeminoleSenegaleseSerbianShoshoneSierra LeoneanSiouxSlavicSlovakSloveneSomaliSouth AfricanSouth AmericanSouth American IndianSoviet UnionSpaniardSpanishSpanish AmericanSpanish American IndianSri LankanSubsaharan AfricanSudaneseSwedishSwissTaiwaneseThaiTlingit-HaidaTohono O'OdhamTonganTrinidadian and TobagonianTsimshianTurkishU.S. Virgin IslanderUgandanUkrainianUruguayanUteVenezuelanVietnameseWelshWest IndianYakamaYaquiYugoslavianYumanYup'ikZimbabwean
Immigration
NonimmigrantsImmigrantsAfghanistanAfricaAlbaniaArgentinaArmeniaAsiaAustraliaAustriaBahamasBangladeshBarbadosBelarusBelgiumBelizeBoliviaBosnia and HerzegovinaBrazilBulgariaBurma/MyanmarCabo VerdeCambodiaCameroonCanadaCaribbeanCentral AmericaChileChinaColombiaCongoCosta RicaCroatiaCubaCzechoslovakiaDenmarkDominicaDominican RepublicEastern AfricaEastern AsiaEastern EuropeEcuadorEgyptEl SalvadorEnglandEritreaEthiopiaEuropeFijiFranceGermanyGhanaGreeceGrenadaGuatemalaGuyanaHaitiHondurasHong KongHungaryIndiaIndonesiaIranIraqIrelandIsraelItalyJamaicaJapanJordanKazakhstanKenyaKoreaKuwaitLaosLatin AmericaLatviaLebanonLiberiaLithuaniaMalaysiaMexicoMicronesiaMiddle AfricaMoldovaMoroccoNepalNetherlandsNicaraguaNigeriaNorth AmericaNorth MacedoniaNorthern AfricaNorthern EuropeNorwayOceaniaPakistanPanamaPeruPhilippinesPolandPortugalRomaniaRussiaSaudi ArabiaScotlandSenegalSerbiaSierra LeoneSingaporeSomaliaSouth AfricaSouth AmericaSouth Central AsiaSouth Eastern AsiaSouthern EuropeSpainSri LankaSt. Vincent and the GrenadinesSudanSwedenSwitzerlandSyriaTaiwanThailandTrinidad and TobagoTurkeyUgandaUkraineUruguayUzbekistanVenezuelaVietnamWest IndiesWestern AfricaWestern AsiaWestern EuropeYemenZaireZimbabweAzores
Unemployment Among Ages 20 to 24 years
Income
Poverty
Unemployment
Labor Participation
Family Structure
Vehicle Availability
Education Level
Disability

Unemployment Among Ages 20 to 24 years Comparison

Syrians

Cheyenne

Fair
Tragic
10.4%
UNEMPLOYMENT AMONG AGES 20 TO 24 YEARS
35.6/ 100
METRIC RATING
185th/ 347
METRIC RANK
13.0%
UNEMPLOYMENT AMONG AGES 20 TO 24 YEARS
0.0/ 100
METRIC RATING
320th/ 347
METRIC RANK

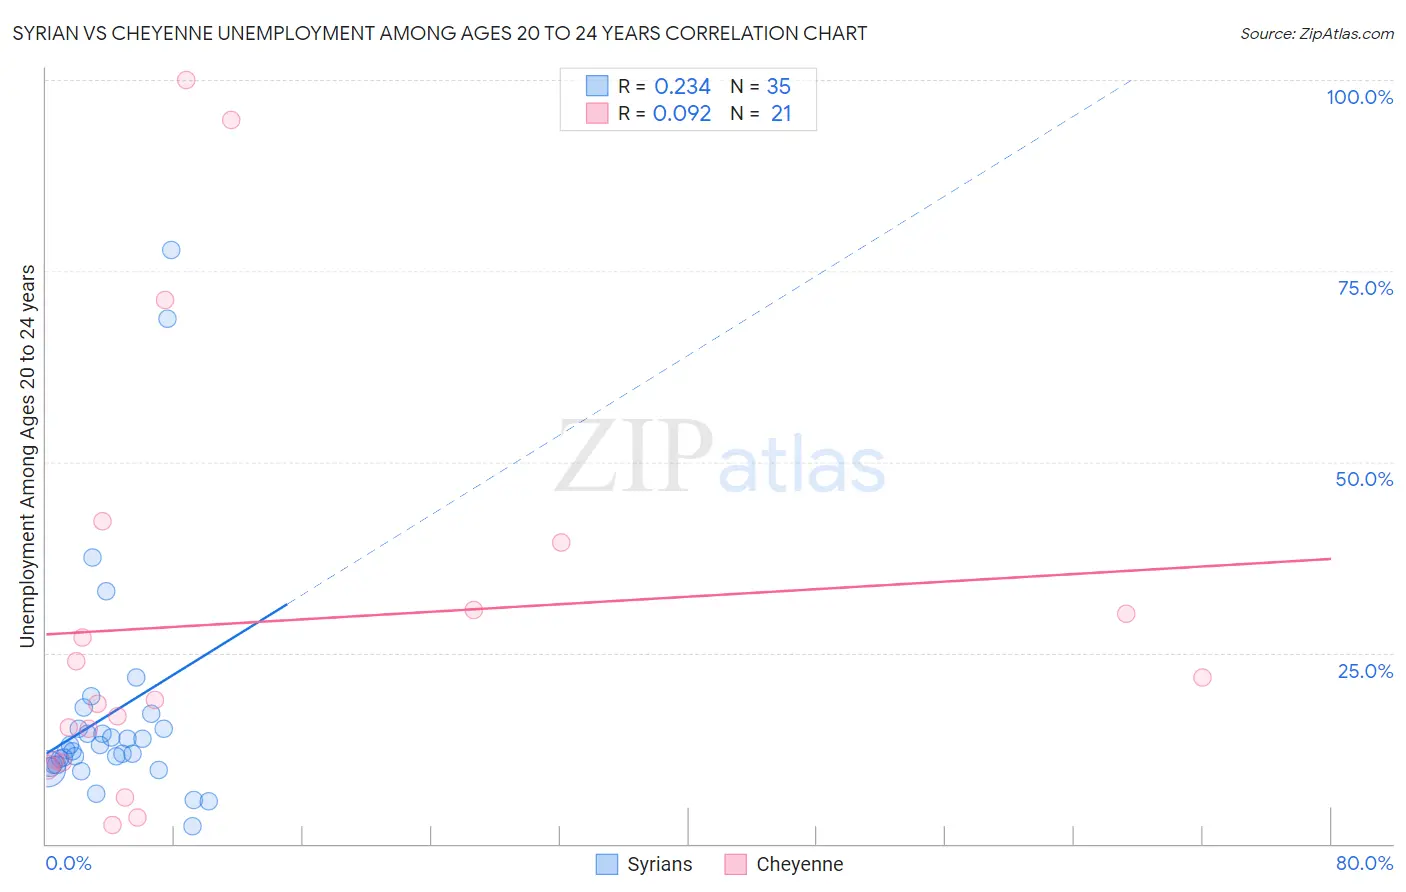
Syrian vs Cheyenne Unemployment Among Ages 20 to 24 years Correlation Chart

The statistical analysis conducted on geographies consisting of 260,959,201 people shows a weak positive correlation between the proportion of Syrians and unemployment rate among population between the ages 20 and 24 in the United States with a correlation coefficient (R) of 0.234 and weighted average of 10.4%. Similarly, the statistical analysis conducted on geographies consisting of 79,602,864 people shows a slight positive correlation between the proportion of Cheyenne and unemployment rate among population between the ages 20 and 24 in the United States with a correlation coefficient (R) of 0.092 and weighted average of 13.0%, a difference of 25.0%.
Syrian vs Cheyenne Unemployment Among Ages 20 to 24 years

Unemployment Among Ages 20 to 24 years Correlation Summary

MeasurementSyrianCheyenne
Minimum2.3%2.4%
Maximum77.8%100.0%
Range75.5%97.6%
Mean16.9%29.0%
Median12.4%18.8%
Interquartile 25% (IQ1)10.3%10.8%
Interquartile 75% (IQ3)15.1%35.0%
Interquartile Range (IQR)4.8%24.3%
Standard Deviation (Sample)15.6%27.5%
Standard Deviation (Population)15.4%26.9%

Similar Demographics by Unemployment Among Ages 20 to 24 years

Demographics Similar to Syrians by Unemployment Among Ages 20 to 24 years

In terms of unemployment among ages 20 to 24 years, the demographic groups most similar to Syrians are Guamanian/Chamorro (10.4%, a difference of 0.010%), Immigrants from Western Europe (10.4%, a difference of 0.030%), Immigrants from Russia (10.4%, a difference of 0.040%), Greek (10.4%, a difference of 0.060%), and Immigrants from Egypt (10.4%, a difference of 0.070%).
DemographicsRating | RankUnemployment Among Ages 20 to 24 years
Alsatians
40.5
/100
|
#178
Average
10.3%
Tlingit-Haida
39.7
/100
|
#179
Fair
10.3%
Immigrants | Turkey
39.3
/100
|
#180
Fair
10.3%
Okinawans
39.1
/100
|
#181
Fair
10.3%
Immigrants | Germany
38.1
/100
|
#182
Fair
10.4%
Immigrants | Egypt
37.4
/100
|
#183
Fair
10.4%
Greeks
37.2
/100
|
#184
Fair
10.4%
Syrians
35.6
/100
|
#185
Fair
10.4%
Guamanians/Chamorros
35.4
/100
|
#186
Fair
10.4%
Immigrants | Western Europe
35.0
/100
|
#187
Fair
10.4%
Immigrants | Russia
34.6
/100
|
#188
Fair
10.4%
Hawaiians
33.9
/100
|
#189
Fair
10.4%
Immigrants | China
32.6
/100
|
#190
Fair
10.4%
Immigrants | Eastern Europe
25.8
/100
|
#191
Fair
10.4%
Ugandans
25.7
/100
|
#192
Fair
10.4%

Demographics Similar to Cheyenne by Unemployment Among Ages 20 to 24 years

In terms of unemployment among ages 20 to 24 years, the demographic groups most similar to Cheyenne are Immigrants from Jamaica (13.0%, a difference of 0.080%), Trinidadian and Tobagonian (12.9%, a difference of 0.42%), Native/Alaskan (13.0%, a difference of 0.47%), Barbadian (12.9%, a difference of 0.68%), and Immigrants from Trinidad and Tobago (12.8%, a difference of 0.93%).
DemographicsRating | RankUnemployment Among Ages 20 to 24 years
Shoshone
0.0
/100
|
#313
Tragic
12.7%
Blacks/African Americans
0.0
/100
|
#314
Tragic
12.7%
West Indians
0.0
/100
|
#315
Tragic
12.8%
Immigrants | Dominica
0.0
/100
|
#316
Tragic
12.8%
Immigrants | Trinidad and Tobago
0.0
/100
|
#317
Tragic
12.8%
Barbadians
0.0
/100
|
#318
Tragic
12.9%
Trinidadians and Tobagonians
0.0
/100
|
#319
Tragic
12.9%
Cheyenne
0.0
/100
|
#320
Tragic
13.0%
Immigrants | Jamaica
0.0
/100
|
#321
Tragic
13.0%
Natives/Alaskans
0.0
/100
|
#322
Tragic
13.0%
Yakama
0.0
/100
|
#323
Tragic
13.1%
Alaska Natives
0.0
/100
|
#324
Tragic
13.2%
Pueblo
0.0
/100
|
#325
Tragic
13.2%
Immigrants | Barbados
0.0
/100
|
#326
Tragic
13.5%
Immigrants | Dominican Republic
0.0
/100
|
#327
Tragic
13.6%