Syrian vs Armenian Unemployment Among Ages 25 to 29 years
COMPARE
Syrian
Armenian
Unemployment Among Ages 25 to 29 years
Unemployment Among Ages 25 to 29 years Comparison
Syrians
Armenians
6.5%
UNEMPLOYMENT AMONG AGES 25 TO 29 YEARS
82.1/ 100
METRIC RATING
125th/ 347
METRIC RANK
7.7%
UNEMPLOYMENT AMONG AGES 25 TO 29 YEARS
0.0/ 100
METRIC RATING
290th/ 347
METRIC RANK
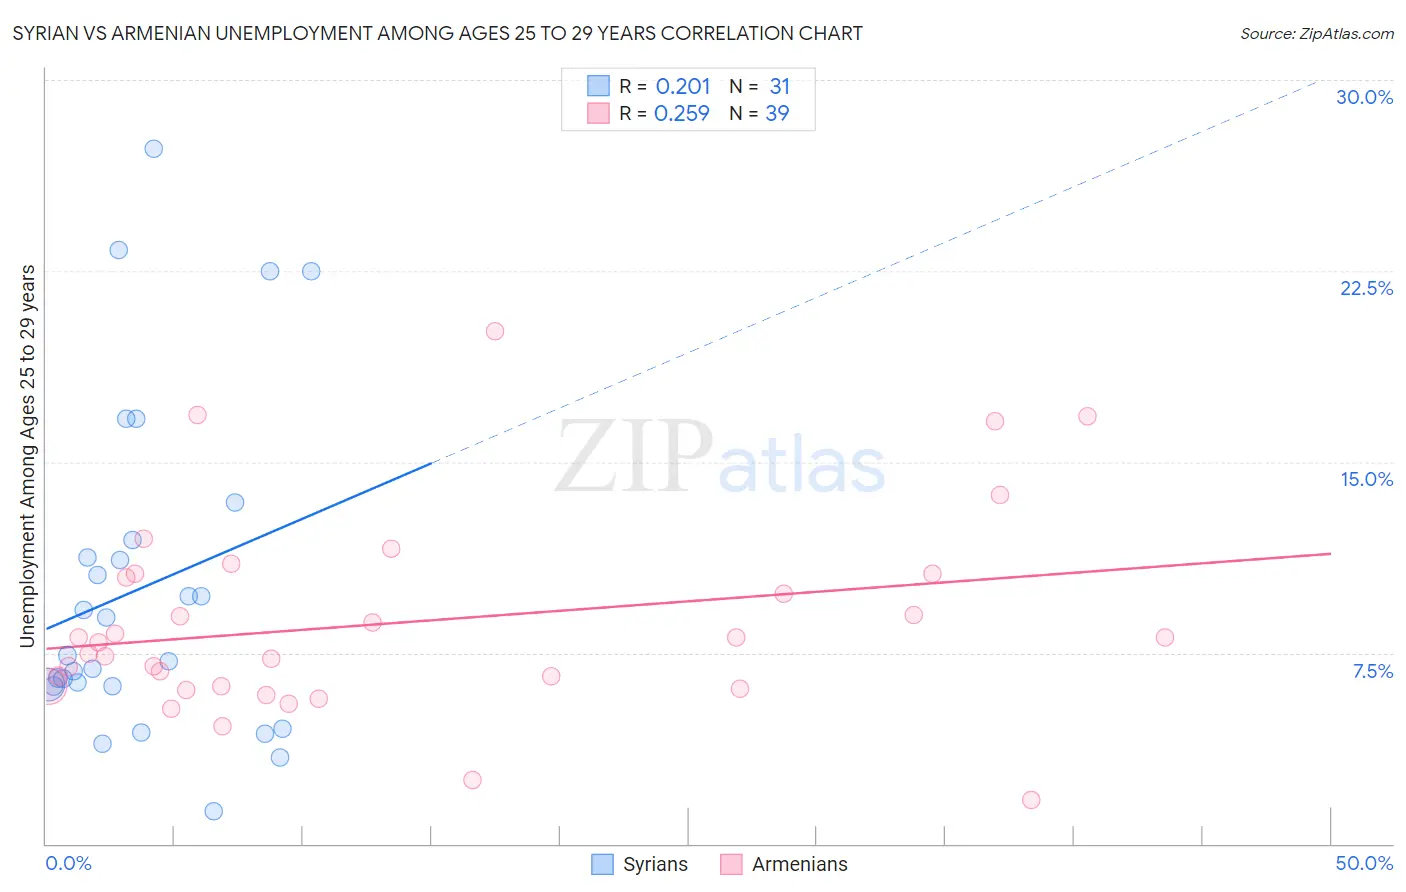
Syrian vs Armenian Unemployment Among Ages 25 to 29 years Correlation Chart
The statistical analysis conducted on geographies consisting of 256,736,419 people shows a weak positive correlation between the proportion of Syrians and unemployment rate among population between the ages 25 and 29 in the United States with a correlation coefficient (R) of 0.201 and weighted average of 6.5%. Similarly, the statistical analysis conducted on geographies consisting of 297,858,760 people shows a weak positive correlation between the proportion of Armenians and unemployment rate among population between the ages 25 and 29 in the United States with a correlation coefficient (R) of 0.259 and weighted average of 7.7%, a difference of 18.6%.
Unemployment Among Ages 25 to 29 years Correlation Summary
| Measurement | Syrian | Armenian |
| Minimum | 1.3% | 1.7% |
| Maximum | 27.3% | 20.1% |
| Range | 26.0% | 18.4% |
| Mean | 10.1% | 8.7% |
| Median | 7.4% | 7.9% |
| Interquartile 25% (IQ1) | 6.2% | 6.2% |
| Interquartile 75% (IQ3) | 11.9% | 10.6% |
| Interquartile Range (IQR) | 5.7% | 4.4% |
| Standard Deviation (Sample) | 6.5% | 3.9% |
| Standard Deviation (Population) | 6.4% | 3.9% |
Similar Demographics by Unemployment Among Ages 25 to 29 years
Demographics Similar to Syrians by Unemployment Among Ages 25 to 29 years
In terms of unemployment among ages 25 to 29 years, the demographic groups most similar to Syrians are Brazilian (6.5%, a difference of 0.020%), Arab (6.5%, a difference of 0.040%), Dutch (6.5%, a difference of 0.15%), Laotian (6.5%, a difference of 0.16%), and Immigrants from Chile (6.5%, a difference of 0.17%).
| Demographics | Rating | Rank | Unemployment Among Ages 25 to 29 years |
| Chileans | 85.3 /100 | #118 | Excellent 6.5% |
| Immigrants | South Africa | 84.9 /100 | #119 | Excellent 6.5% |
| Immigrants | Moldova | 84.5 /100 | #120 | Excellent 6.5% |
| Immigrants | Uganda | 84.5 /100 | #121 | Excellent 6.5% |
| Immigrants | Belarus | 83.7 /100 | #122 | Excellent 6.5% |
| Laotians | 83.6 /100 | #123 | Excellent 6.5% |
| Arabs | 82.5 /100 | #124 | Excellent 6.5% |
| Syrians | 82.1 /100 | #125 | Excellent 6.5% |
| Brazilians | 81.9 /100 | #126 | Excellent 6.5% |
| Dutch | 80.6 /100 | #127 | Excellent 6.5% |
| Immigrants | Chile | 80.5 /100 | #128 | Excellent 6.5% |
| Sri Lankans | 80.3 /100 | #129 | Excellent 6.5% |
| Immigrants | Peru | 79.9 /100 | #130 | Good 6.5% |
| Immigrants | Afghanistan | 79.2 /100 | #131 | Good 6.5% |
| Poles | 76.6 /100 | #132 | Good 6.5% |
Demographics Similar to Armenians by Unemployment Among Ages 25 to 29 years
In terms of unemployment among ages 25 to 29 years, the demographic groups most similar to Armenians are Belizean (7.7%, a difference of 0.10%), Hispanic or Latino (7.7%, a difference of 0.39%), Chippewa (7.8%, a difference of 0.80%), African (7.6%, a difference of 0.81%), and Immigrants from Belize (7.8%, a difference of 0.85%).
| Demographics | Rating | Rank | Unemployment Among Ages 25 to 29 years |
| Creek | 0.0 /100 | #283 | Tragic 7.6% |
| Cherokee | 0.0 /100 | #284 | Tragic 7.6% |
| Senegalese | 0.0 /100 | #285 | Tragic 7.6% |
| Vietnamese | 0.0 /100 | #286 | Tragic 7.6% |
| Immigrants | Mexico | 0.0 /100 | #287 | Tragic 7.6% |
| Africans | 0.0 /100 | #288 | Tragic 7.6% |
| Belizeans | 0.0 /100 | #289 | Tragic 7.7% |
| Armenians | 0.0 /100 | #290 | Tragic 7.7% |
| Hispanics or Latinos | 0.0 /100 | #291 | Tragic 7.7% |
| Chippewa | 0.0 /100 | #292 | Tragic 7.8% |
| Immigrants | Belize | 0.0 /100 | #293 | Tragic 7.8% |
| Trinidadians and Tobagonians | 0.0 /100 | #294 | Tragic 7.8% |
| Comanche | 0.0 /100 | #295 | Tragic 7.8% |
| Immigrants | West Indies | 0.0 /100 | #296 | Tragic 7.8% |
| Blackfeet | 0.0 /100 | #297 | Tragic 7.9% |