Swiss vs Tongan Unemployment Among Youth under 25 years
COMPARE
Swiss
Tongan
Unemployment Among Youth under 25 years
Unemployment Among Youth under 25 years Comparison
Swiss
Tongans
10.6%
UNEMPLOYMENT AMONG YOUTH UNDER 25 YEARS
100.0/ 100
METRIC RATING
18th/ 347
METRIC RANK
10.9%
UNEMPLOYMENT AMONG YOUTH UNDER 25 YEARS
99.6/ 100
METRIC RATING
46th/ 347
METRIC RANK
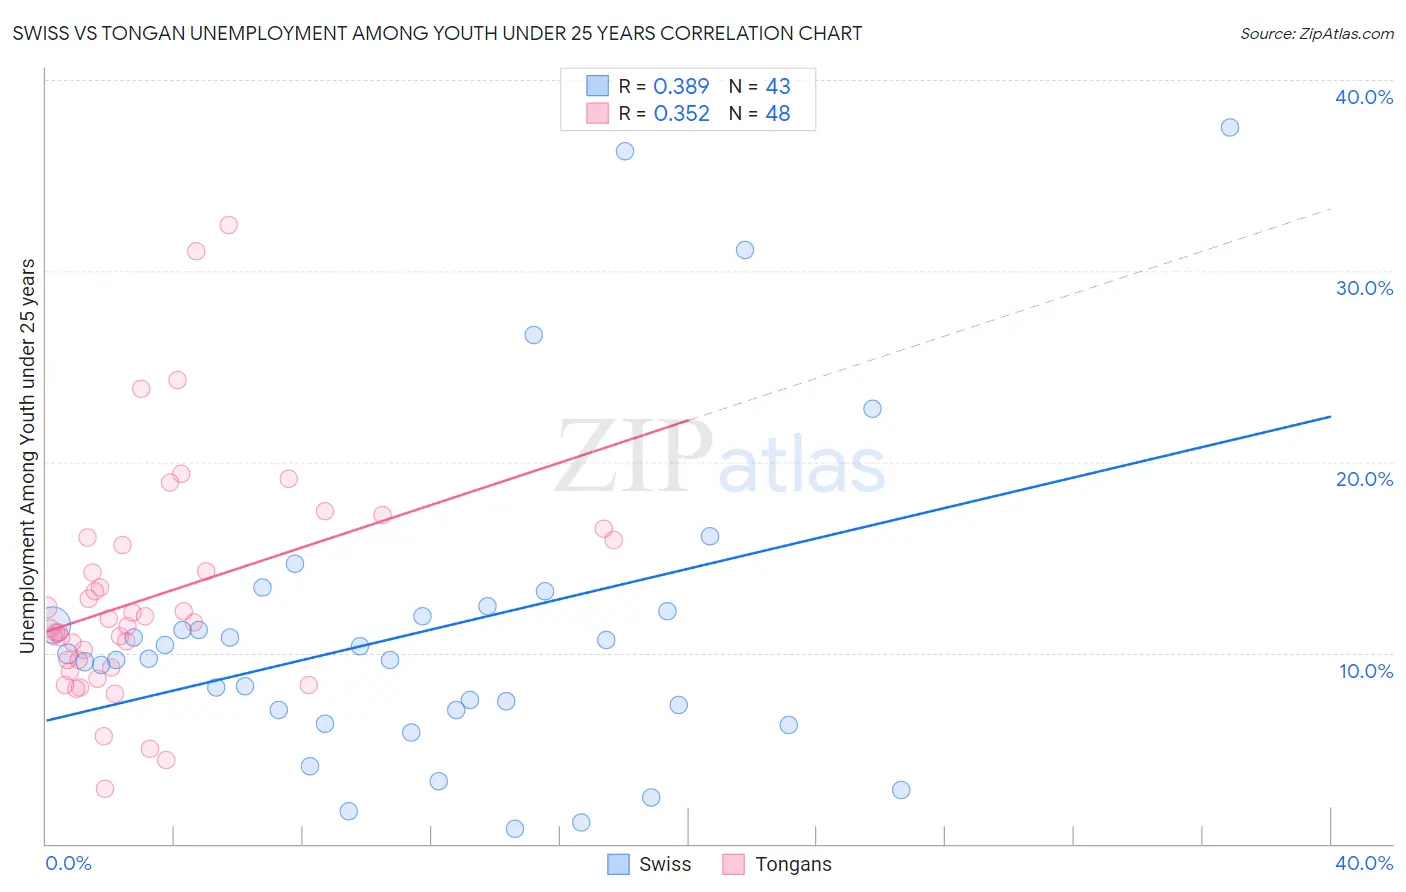
Swiss vs Tongan Unemployment Among Youth under 25 years Correlation Chart
The statistical analysis conducted on geographies consisting of 453,445,533 people shows a mild positive correlation between the proportion of Swiss and unemployment rate among youth under the age of 25 in the United States with a correlation coefficient (R) of 0.389 and weighted average of 10.6%. Similarly, the statistical analysis conducted on geographies consisting of 102,589,279 people shows a mild positive correlation between the proportion of Tongans and unemployment rate among youth under the age of 25 in the United States with a correlation coefficient (R) of 0.352 and weighted average of 10.9%, a difference of 3.2%.
Unemployment Among Youth under 25 years Correlation Summary
| Measurement | Swiss | Tongan |
| Minimum | 0.80% | 2.9% |
| Maximum | 37.5% | 32.4% |
| Range | 36.7% | 29.5% |
| Mean | 11.2% | 12.9% |
| Median | 9.7% | 11.5% |
| Interquartile 25% (IQ1) | 7.0% | 9.4% |
| Interquartile 75% (IQ3) | 12.2% | 15.8% |
| Interquartile Range (IQR) | 5.1% | 6.4% |
| Standard Deviation (Sample) | 8.3% | 6.0% |
| Standard Deviation (Population) | 8.2% | 5.9% |
Similar Demographics by Unemployment Among Youth under 25 years
Demographics Similar to Swiss by Unemployment Among Youth under 25 years
In terms of unemployment among youth under 25 years, the demographic groups most similar to Swiss are Immigrants from Burma/Myanmar (10.6%, a difference of 0.010%), Dutch (10.6%, a difference of 0.030%), Menominee (10.6%, a difference of 0.16%), Venezuelan (10.6%, a difference of 0.20%), and Sudanese (10.6%, a difference of 0.21%).
| Demographics | Rating | Rank | Unemployment Among Youth under 25 years |
| Scandinavians | 100.0 /100 | #11 | Exceptional 10.5% |
| Immigrants | Sudan | 100.0 /100 | #12 | Exceptional 10.5% |
| Indonesians | 100.0 /100 | #13 | Exceptional 10.6% |
| Cubans | 100.0 /100 | #14 | Exceptional 10.6% |
| Sudanese | 100.0 /100 | #15 | Exceptional 10.6% |
| Venezuelans | 100.0 /100 | #16 | Exceptional 10.6% |
| Menominee | 100.0 /100 | #17 | Exceptional 10.6% |
| Swiss | 100.0 /100 | #18 | Exceptional 10.6% |
| Immigrants | Burma/Myanmar | 100.0 /100 | #19 | Exceptional 10.6% |
| Dutch | 100.0 /100 | #20 | Exceptional 10.6% |
| Pennsylvania Germans | 100.0 /100 | #21 | Exceptional 10.6% |
| Belgians | 100.0 /100 | #22 | Exceptional 10.6% |
| Immigrants | Bosnia and Herzegovina | 100.0 /100 | #23 | Exceptional 10.6% |
| Finns | 100.0 /100 | #24 | Exceptional 10.7% |
| Immigrants | North Macedonia | 100.0 /100 | #25 | Exceptional 10.7% |
Demographics Similar to Tongans by Unemployment Among Youth under 25 years
In terms of unemployment among youth under 25 years, the demographic groups most similar to Tongans are Bulgarian (10.9%, a difference of 0.040%), Australian (10.9%, a difference of 0.040%), Welsh (10.9%, a difference of 0.14%), British (10.9%, a difference of 0.17%), and Cambodian (10.9%, a difference of 0.42%).
| Demographics | Rating | Rank | Unemployment Among Youth under 25 years |
| Immigrants | Zaire | 99.8 /100 | #39 | Exceptional 10.9% |
| Scottish | 99.8 /100 | #40 | Exceptional 10.9% |
| Croatians | 99.8 /100 | #41 | Exceptional 10.9% |
| Cambodians | 99.7 /100 | #42 | Exceptional 10.9% |
| British | 99.7 /100 | #43 | Exceptional 10.9% |
| Welsh | 99.7 /100 | #44 | Exceptional 10.9% |
| Bulgarians | 99.6 /100 | #45 | Exceptional 10.9% |
| Tongans | 99.6 /100 | #46 | Exceptional 10.9% |
| Australians | 99.6 /100 | #47 | Exceptional 10.9% |
| Poles | 99.3 /100 | #48 | Exceptional 11.0% |
| Thais | 99.3 /100 | #49 | Exceptional 11.0% |
| Czechoslovakians | 99.2 /100 | #50 | Exceptional 11.0% |
| Serbians | 99.0 /100 | #51 | Exceptional 11.0% |
| Latvians | 99.0 /100 | #52 | Exceptional 11.0% |
| Ottawa | 99.0 /100 | #53 | Exceptional 11.1% |