Swedish vs Immigrants from Zaire Unemployment Among Ages 16 to 19 years
COMPARE
Swedish
Immigrants from Zaire
Unemployment Among Ages 16 to 19 years
Unemployment Among Ages 16 to 19 years Comparison
Swedes
Immigrants from Zaire
15.3%
UNEMPLOYMENT AMONG AGES 16 TO 19 YEARS
100.0/ 100
METRIC RATING
6th/ 347
METRIC RANK
15.6%
UNEMPLOYMENT AMONG AGES 16 TO 19 YEARS
100.0/ 100
METRIC RATING
14th/ 347
METRIC RANK
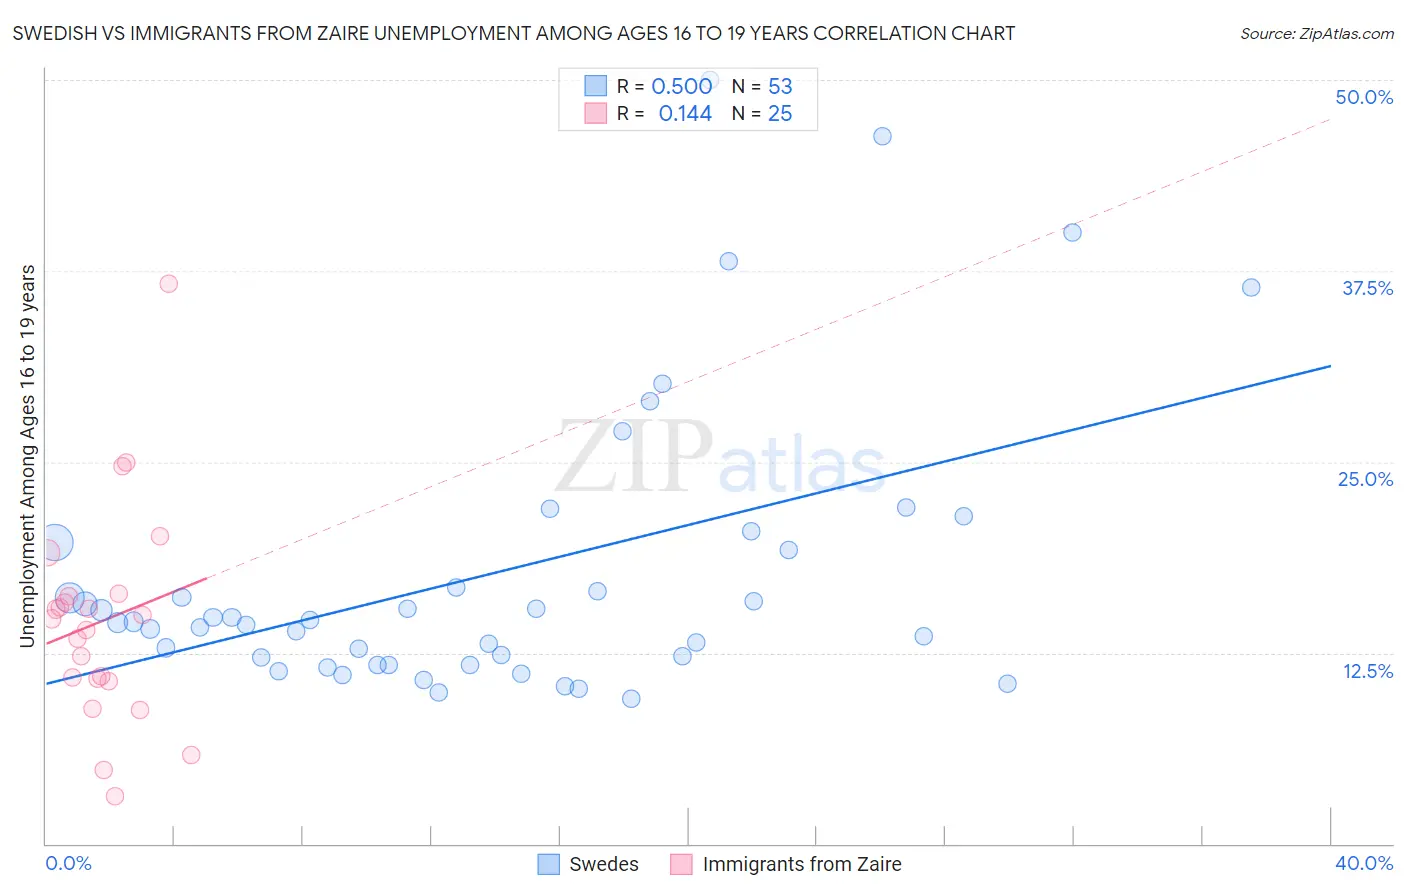
Swedish vs Immigrants from Zaire Unemployment Among Ages 16 to 19 years Correlation Chart
The statistical analysis conducted on geographies consisting of 486,284,600 people shows a moderate positive correlation between the proportion of Swedes and unemployment rate among population between the ages 16 and 19 in the United States with a correlation coefficient (R) of 0.500 and weighted average of 15.3%. Similarly, the statistical analysis conducted on geographies consisting of 106,126,404 people shows a poor positive correlation between the proportion of Immigrants from Zaire and unemployment rate among population between the ages 16 and 19 in the United States with a correlation coefficient (R) of 0.144 and weighted average of 15.6%, a difference of 2.0%.
Unemployment Among Ages 16 to 19 years Correlation Summary
| Measurement | Swedish | Immigrants from Zaire |
| Minimum | 9.5% | 3.1% |
| Maximum | 50.0% | 36.7% |
| Range | 40.5% | 33.6% |
| Mean | 17.7% | 14.6% |
| Median | 14.5% | 14.7% |
| Interquartile 25% (IQ1) | 12.0% | 10.7% |
| Interquartile 75% (IQ3) | 19.5% | 16.3% |
| Interquartile Range (IQR) | 7.5% | 5.6% |
| Standard Deviation (Sample) | 9.3% | 7.1% |
| Standard Deviation (Population) | 9.2% | 6.9% |
Demographics Similar to Swedes and Immigrants from Zaire by Unemployment Among Ages 16 to 19 years
In terms of unemployment among ages 16 to 19 years, the demographic groups most similar to Swedes are Immigrants from Bosnia and Herzegovina (15.3%, a difference of 0.17%), Immigrants from Somalia (15.3%, a difference of 0.27%), Czech (15.4%, a difference of 0.41%), Scandinavian (15.4%, a difference of 0.74%), and Zimbabwean (15.4%, a difference of 0.86%). Similarly, the demographic groups most similar to Immigrants from Zaire are Yugoslavian (15.6%, a difference of 0.050%), Immigrants from Burma/Myanmar (15.6%, a difference of 0.14%), German (15.7%, a difference of 0.34%), Somali (15.7%, a difference of 0.55%), and Taiwanese (15.5%, a difference of 0.58%).
| Demographics | Rating | Rank | Unemployment Among Ages 16 to 19 years |
| Norwegians | 100.0 /100 | #1 | Exceptional 14.5% |
| Immigrants | India | 100.0 /100 | #2 | Exceptional 15.0% |
| Luxembourgers | 100.0 /100 | #3 | Exceptional 15.1% |
| Danes | 100.0 /100 | #4 | Exceptional 15.2% |
| Immigrants | Somalia | 100.0 /100 | #5 | Exceptional 15.3% |
| Swedes | 100.0 /100 | #6 | Exceptional 15.3% |
| Immigrants | Bosnia and Herzegovina | 100.0 /100 | #7 | Exceptional 15.3% |
| Czechs | 100.0 /100 | #8 | Exceptional 15.4% |
| Scandinavians | 100.0 /100 | #9 | Exceptional 15.4% |
| Zimbabweans | 100.0 /100 | #10 | Exceptional 15.4% |
| Indonesians | 100.0 /100 | #11 | Exceptional 15.5% |
| Taiwanese | 100.0 /100 | #12 | Exceptional 15.5% |
| Immigrants | Burma/Myanmar | 100.0 /100 | #13 | Exceptional 15.6% |
| Immigrants | Zaire | 100.0 /100 | #14 | Exceptional 15.6% |
| Yugoslavians | 100.0 /100 | #15 | Exceptional 15.6% |
| Germans | 100.0 /100 | #16 | Exceptional 15.7% |
| Somalis | 100.0 /100 | #17 | Exceptional 15.7% |
| Thais | 100.0 /100 | #18 | Exceptional 15.7% |
| Swiss | 100.0 /100 | #19 | Exceptional 15.8% |
| Sudanese | 100.0 /100 | #20 | Exceptional 15.8% |