Swedish vs Alaskan Athabascan Unemployment Among Ages 60 to 64 years
COMPARE
Swedish
Alaskan Athabascan
Unemployment Among Ages 60 to 64 years
Unemployment Among Ages 60 to 64 years Comparison
Swedes
Alaskan Athabascans
4.5%
UNEMPLOYMENT AMONG AGES 60 TO 64 YEARS
100.0/ 100
METRIC RATING
43rd/ 347
METRIC RANK
8.4%
UNEMPLOYMENT AMONG AGES 60 TO 64 YEARS
0.0/ 100
METRIC RATING
345th/ 347
METRIC RANK
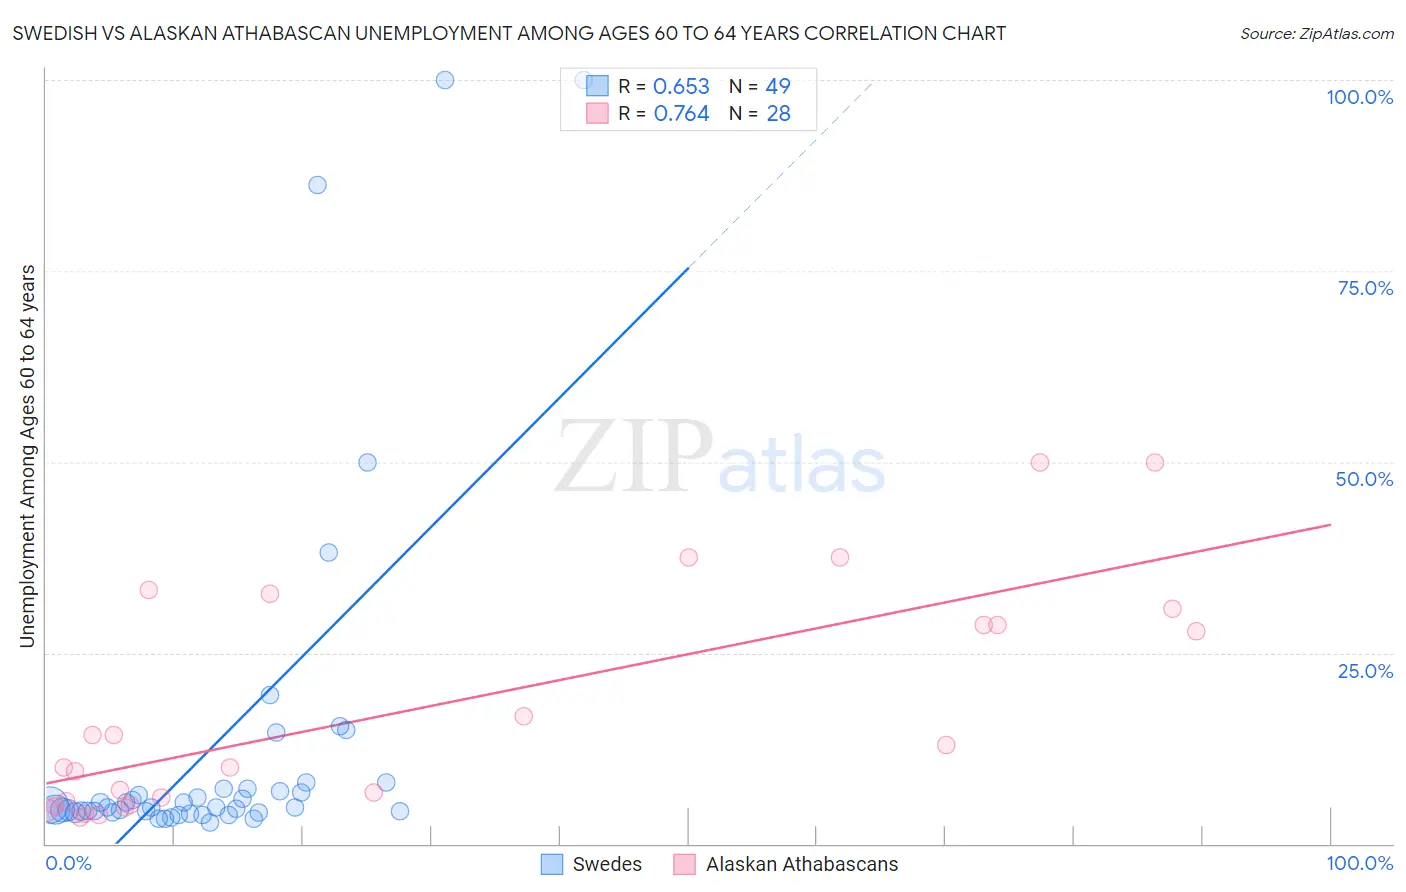
Swedish vs Alaskan Athabascan Unemployment Among Ages 60 to 64 years Correlation Chart
The statistical analysis conducted on geographies consisting of 448,314,180 people shows a significant positive correlation between the proportion of Swedes and unemployment rate among population between the ages 60 and 64 in the United States with a correlation coefficient (R) of 0.653 and weighted average of 4.5%. Similarly, the statistical analysis conducted on geographies consisting of 44,056,106 people shows a strong positive correlation between the proportion of Alaskan Athabascans and unemployment rate among population between the ages 60 and 64 in the United States with a correlation coefficient (R) of 0.764 and weighted average of 8.4%, a difference of 85.5%.
Unemployment Among Ages 60 to 64 years Correlation Summary
| Measurement | Swedish | Alaskan Athabascan |
| Minimum | 2.8% | 3.4% |
| Maximum | 100.0% | 50.0% |
| Range | 97.2% | 46.6% |
| Mean | 13.0% | 17.9% |
| Median | 4.8% | 11.5% |
| Interquartile 25% (IQ1) | 4.2% | 5.3% |
| Interquartile 75% (IQ3) | 7.2% | 29.7% |
| Interquartile Range (IQR) | 3.0% | 24.4% |
| Standard Deviation (Sample) | 22.9% | 14.7% |
| Standard Deviation (Population) | 22.7% | 14.5% |
Similar Demographics by Unemployment Among Ages 60 to 64 years
Demographics Similar to Swedes by Unemployment Among Ages 60 to 64 years
In terms of unemployment among ages 60 to 64 years, the demographic groups most similar to Swedes are European (4.5%, a difference of 0.060%), English (4.5%, a difference of 0.17%), Immigrants from Sudan (4.5%, a difference of 0.22%), Liberian (4.5%, a difference of 0.29%), and Scandinavian (4.5%, a difference of 0.35%).
| Demographics | Rating | Rank | Unemployment Among Ages 60 to 64 years |
| Venezuelans | 100.0 /100 | #36 | Exceptional 4.5% |
| Immigrants | Portugal | 100.0 /100 | #37 | Exceptional 4.5% |
| Native Hawaiians | 100.0 /100 | #38 | Exceptional 4.5% |
| Iraqis | 100.0 /100 | #39 | Exceptional 4.5% |
| Scandinavians | 100.0 /100 | #40 | Exceptional 4.5% |
| Immigrants | Sudan | 100.0 /100 | #41 | Exceptional 4.5% |
| English | 100.0 /100 | #42 | Exceptional 4.5% |
| Swedes | 100.0 /100 | #43 | Exceptional 4.5% |
| Europeans | 100.0 /100 | #44 | Exceptional 4.5% |
| Liberians | 99.9 /100 | #45 | Exceptional 4.5% |
| Bhutanese | 99.9 /100 | #46 | Exceptional 4.5% |
| Assyrians/Chaldeans/Syriacs | 99.9 /100 | #47 | Exceptional 4.5% |
| Immigrants | Zimbabwe | 99.9 /100 | #48 | Exceptional 4.6% |
| Scotch-Irish | 99.9 /100 | #49 | Exceptional 4.6% |
| Scottish | 99.9 /100 | #50 | Exceptional 4.6% |
Demographics Similar to Alaskan Athabascans by Unemployment Among Ages 60 to 64 years
In terms of unemployment among ages 60 to 64 years, the demographic groups most similar to Alaskan Athabascans are Alaska Native (7.6%, a difference of 10.0%), Inupiat (9.6%, a difference of 14.2%), Immigrants from Yemen (6.8%, a difference of 22.9%), Aleut (6.8%, a difference of 23.8%), and Yuman (6.8%, a difference of 23.8%).
| Demographics | Rating | Rank | Unemployment Among Ages 60 to 64 years |
| Immigrants | Dominican Republic | 0.0 /100 | #333 | Tragic 6.0% |
| Puerto Ricans | 0.0 /100 | #334 | Tragic 6.1% |
| Vietnamese | 0.0 /100 | #335 | Tragic 6.1% |
| Kiowa | 0.0 /100 | #336 | Tragic 6.2% |
| Navajo | 0.0 /100 | #337 | Tragic 6.3% |
| Arapaho | 0.0 /100 | #338 | Tragic 6.3% |
| Tlingit-Haida | 0.0 /100 | #339 | Tragic 6.4% |
| Pueblo | 0.0 /100 | #340 | Tragic 6.7% |
| Yuman | 0.0 /100 | #341 | Tragic 6.8% |
| Aleuts | 0.0 /100 | #342 | Tragic 6.8% |
| Immigrants | Yemen | 0.0 /100 | #343 | Tragic 6.8% |
| Alaska Natives | 0.0 /100 | #344 | Tragic 7.6% |
| Alaskan Athabascans | 0.0 /100 | #345 | Tragic 8.4% |
| Inupiat | 0.0 /100 | #346 | Tragic 9.6% |
| Yup'ik | 0.0 /100 | #347 | Tragic 11.9% |