Subsaharan African vs Danish Unemployment Among Ages 55 to 59 years
COMPARE
Subsaharan African
Danish
Unemployment Among Ages 55 to 59 years
Unemployment Among Ages 55 to 59 years Comparison
Sub-Saharan Africans
Danes
5.0%
UNEMPLOYMENT AMONG AGES 55 TO 59 YEARS
4.4/ 100
METRIC RATING
224th/ 347
METRIC RANK
4.3%
UNEMPLOYMENT AMONG AGES 55 TO 59 YEARS
100.0/ 100
METRIC RATING
12th/ 347
METRIC RANK
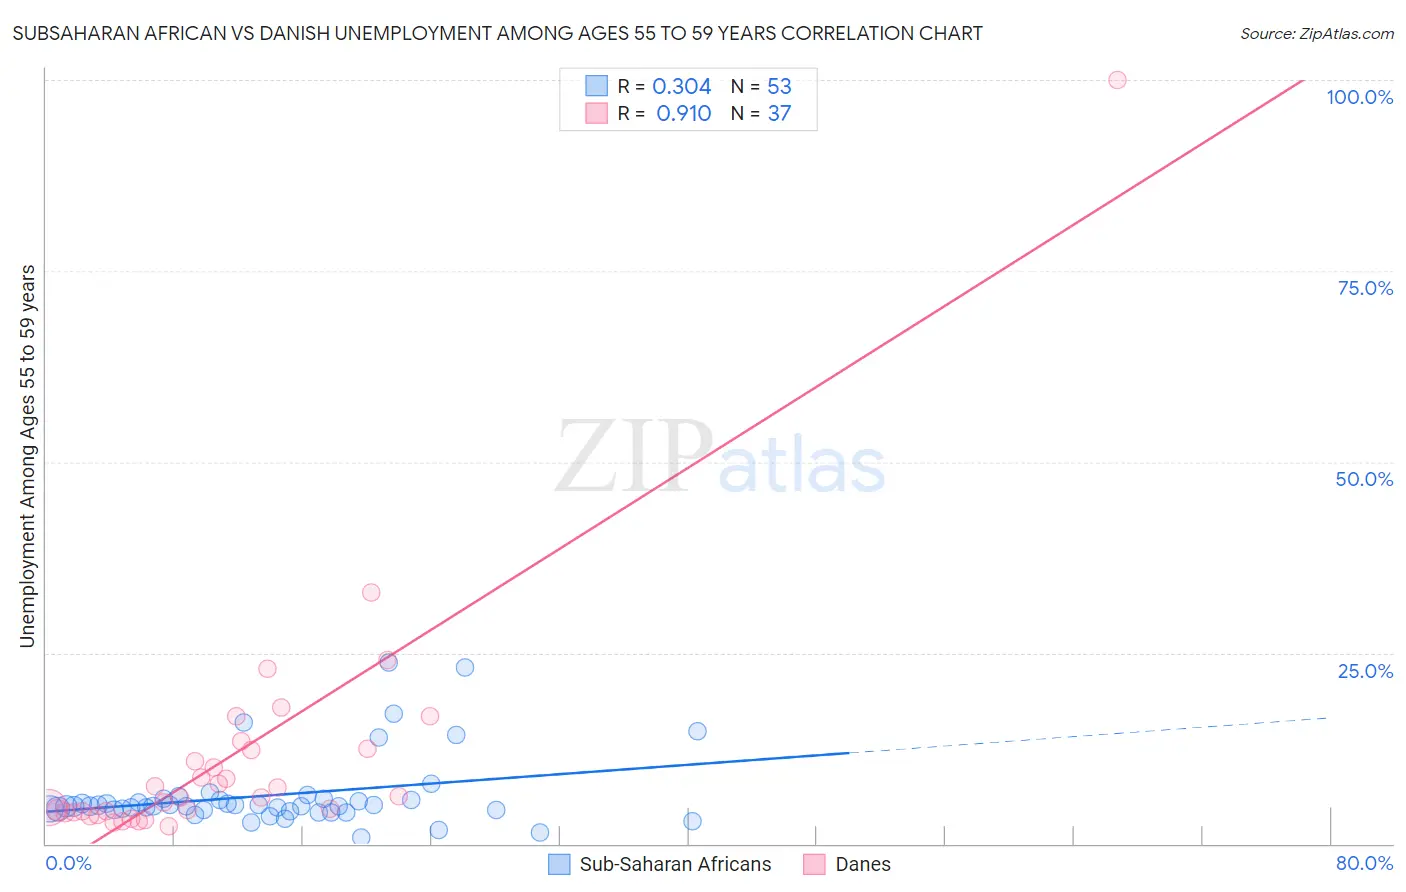
Subsaharan African vs Danish Unemployment Among Ages 55 to 59 years Correlation Chart
The statistical analysis conducted on geographies consisting of 455,758,057 people shows a mild positive correlation between the proportion of Sub-Saharan Africans and unemployment rate among population between the ages 55 and 59 in the United States with a correlation coefficient (R) of 0.304 and weighted average of 5.0%. Similarly, the statistical analysis conducted on geographies consisting of 423,750,471 people shows a near-perfect positive correlation between the proportion of Danes and unemployment rate among population between the ages 55 and 59 in the United States with a correlation coefficient (R) of 0.910 and weighted average of 4.3%, a difference of 15.2%.
Unemployment Among Ages 55 to 59 years Correlation Summary
| Measurement | Subsaharan African | Danish |
| Minimum | 0.90% | 2.4% |
| Maximum | 23.7% | 100.0% |
| Range | 22.8% | 97.6% |
| Mean | 6.4% | 11.2% |
| Median | 4.9% | 6.1% |
| Interquartile 25% (IQ1) | 4.4% | 4.1% |
| Interquartile 75% (IQ3) | 5.8% | 12.4% |
| Interquartile Range (IQR) | 1.4% | 8.3% |
| Standard Deviation (Sample) | 4.8% | 16.5% |
| Standard Deviation (Population) | 4.7% | 16.3% |
Similar Demographics by Unemployment Among Ages 55 to 59 years
Demographics Similar to Sub-Saharan Africans by Unemployment Among Ages 55 to 59 years
In terms of unemployment among ages 55 to 59 years, the demographic groups most similar to Sub-Saharan Africans are Costa Rican (5.0%, a difference of 0.010%), Immigrants from China (5.0%, a difference of 0.060%), Immigrants from Ireland (5.0%, a difference of 0.070%), Spanish (5.0%, a difference of 0.14%), and Immigrants from Iran (5.0%, a difference of 0.19%).
| Demographics | Rating | Rank | Unemployment Among Ages 55 to 59 years |
| Immigrants | Brazil | 8.1 /100 | #217 | Tragic 4.9% |
| Immigrants | Austria | 8.0 /100 | #218 | Tragic 4.9% |
| Immigrants | Nigeria | 8.0 /100 | #219 | Tragic 4.9% |
| Indians (Asian) | 7.6 /100 | #220 | Tragic 4.9% |
| Nigerians | 7.5 /100 | #221 | Tragic 4.9% |
| Spanish | 5.1 /100 | #222 | Tragic 5.0% |
| Immigrants | Ireland | 4.8 /100 | #223 | Tragic 5.0% |
| Sub-Saharan Africans | 4.4 /100 | #224 | Tragic 5.0% |
| Costa Ricans | 4.4 /100 | #225 | Tragic 5.0% |
| Immigrants | China | 4.2 /100 | #226 | Tragic 5.0% |
| Immigrants | Iran | 3.7 /100 | #227 | Tragic 5.0% |
| Immigrants | Liberia | 3.2 /100 | #228 | Tragic 5.0% |
| Immigrants | Western Asia | 3.0 /100 | #229 | Tragic 5.0% |
| Immigrants | Syria | 2.7 /100 | #230 | Tragic 5.0% |
| Cherokee | 2.6 /100 | #231 | Tragic 5.0% |
Demographics Similar to Danes by Unemployment Among Ages 55 to 59 years
In terms of unemployment among ages 55 to 59 years, the demographic groups most similar to Danes are Immigrants from Congo (4.3%, a difference of 0.19%), Indonesian (4.3%, a difference of 0.26%), Immigrants from India (4.3%, a difference of 0.41%), Bulgarian (4.3%, a difference of 0.67%), and Tongan (4.3%, a difference of 0.71%).
| Demographics | Rating | Rank | Unemployment Among Ages 55 to 59 years |
| Immigrants | Bolivia | 100.0 /100 | #5 | Exceptional 4.2% |
| Norwegians | 100.0 /100 | #6 | Exceptional 4.2% |
| Zimbabweans | 100.0 /100 | #7 | Exceptional 4.2% |
| Bolivians | 100.0 /100 | #8 | Exceptional 4.2% |
| Cubans | 100.0 /100 | #9 | Exceptional 4.2% |
| Tongans | 100.0 /100 | #10 | Exceptional 4.3% |
| Immigrants | Congo | 100.0 /100 | #11 | Exceptional 4.3% |
| Danes | 100.0 /100 | #12 | Exceptional 4.3% |
| Indonesians | 100.0 /100 | #13 | Exceptional 4.3% |
| Immigrants | India | 100.0 /100 | #14 | Exceptional 4.3% |
| Bulgarians | 100.0 /100 | #15 | Exceptional 4.3% |
| Somalis | 100.0 /100 | #16 | Exceptional 4.4% |
| Czechs | 100.0 /100 | #17 | Exceptional 4.4% |
| Immigrants | Somalia | 100.0 /100 | #18 | Exceptional 4.4% |
| Chinese | 100.0 /100 | #19 | Exceptional 4.4% |