Sri Lankan vs Somali Unemployment Among Ages 25 to 29 years
COMPARE
Sri Lankan
Somali
Unemployment Among Ages 25 to 29 years
Unemployment Among Ages 25 to 29 years Comparison
Sri Lankans
Somalis
6.5%
UNEMPLOYMENT AMONG AGES 25 TO 29 YEARS
80.3/ 100
METRIC RATING
129th/ 347
METRIC RANK
5.6%
UNEMPLOYMENT AMONG AGES 25 TO 29 YEARS
100.0/ 100
METRIC RATING
5th/ 347
METRIC RANK
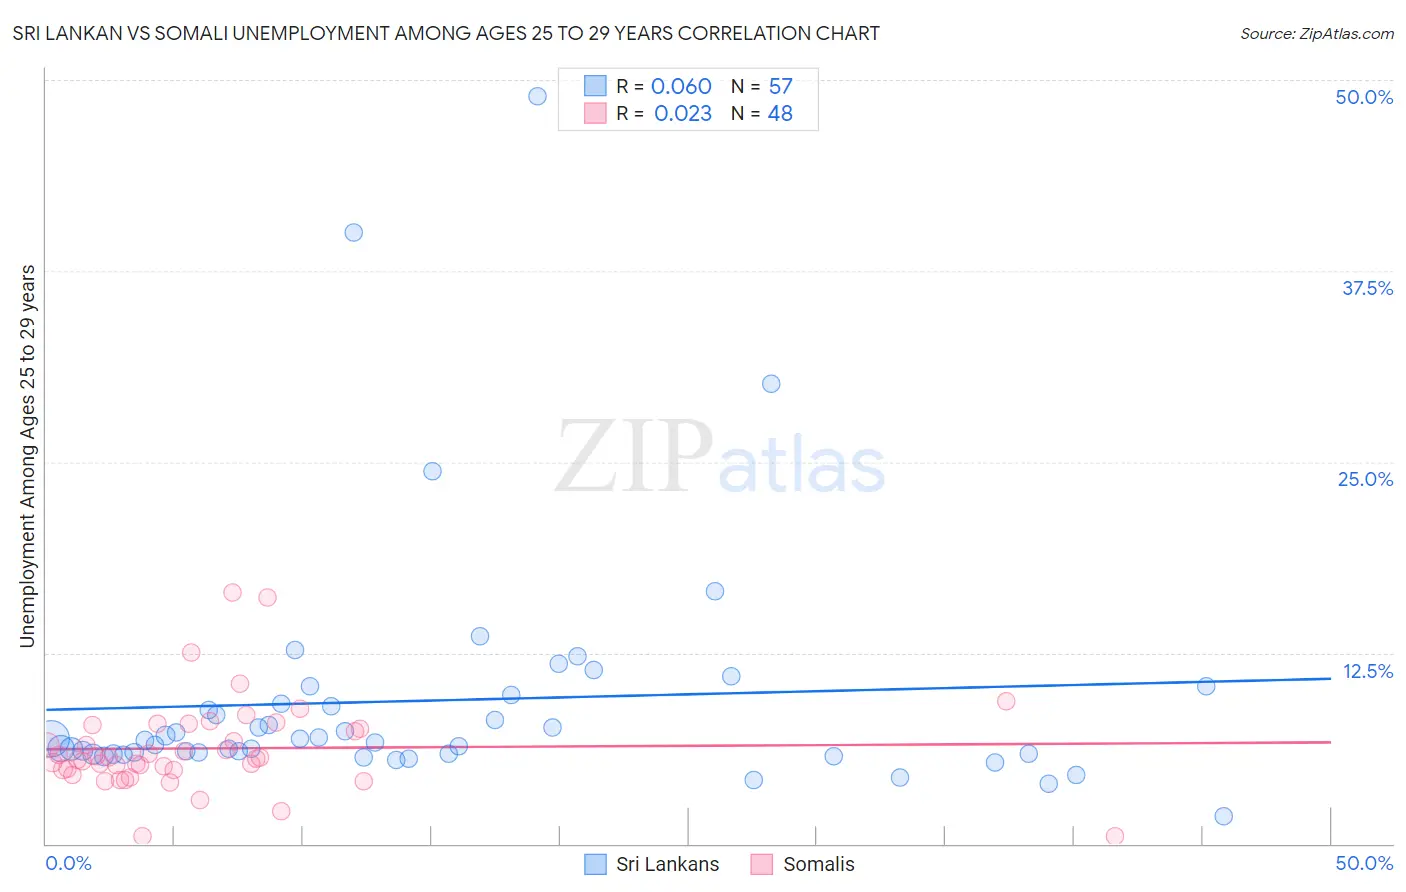
Sri Lankan vs Somali Unemployment Among Ages 25 to 29 years Correlation Chart
The statistical analysis conducted on geographies consisting of 417,939,567 people shows a slight positive correlation between the proportion of Sri Lankans and unemployment rate among population between the ages 25 and 29 in the United States with a correlation coefficient (R) of 0.060 and weighted average of 6.5%. Similarly, the statistical analysis conducted on geographies consisting of 98,062,489 people shows no correlation between the proportion of Somalis and unemployment rate among population between the ages 25 and 29 in the United States with a correlation coefficient (R) of 0.023 and weighted average of 5.6%, a difference of 15.1%.
Unemployment Among Ages 25 to 29 years Correlation Summary
| Measurement | Sri Lankan | Somali |
| Minimum | 1.8% | 0.50% |
| Maximum | 48.9% | 16.4% |
| Range | 47.1% | 15.9% |
| Mean | 9.4% | 6.2% |
| Median | 6.8% | 5.6% |
| Interquartile 25% (IQ1) | 5.9% | 4.9% |
| Interquartile 75% (IQ3) | 9.5% | 7.7% |
| Interquartile Range (IQR) | 3.6% | 2.8% |
| Standard Deviation (Sample) | 8.2% | 3.0% |
| Standard Deviation (Population) | 8.1% | 3.0% |
Similar Demographics by Unemployment Among Ages 25 to 29 years
Demographics Similar to Sri Lankans by Unemployment Among Ages 25 to 29 years
In terms of unemployment among ages 25 to 29 years, the demographic groups most similar to Sri Lankans are Immigrants from Chile (6.5%, a difference of 0.020%), Immigrants from Peru (6.5%, a difference of 0.030%), Dutch (6.5%, a difference of 0.040%), Immigrants from Afghanistan (6.5%, a difference of 0.11%), and Brazilian (6.5%, a difference of 0.17%).
| Demographics | Rating | Rank | Unemployment Among Ages 25 to 29 years |
| Immigrants | Belarus | 83.7 /100 | #122 | Excellent 6.5% |
| Laotians | 83.6 /100 | #123 | Excellent 6.5% |
| Arabs | 82.5 /100 | #124 | Excellent 6.5% |
| Syrians | 82.1 /100 | #125 | Excellent 6.5% |
| Brazilians | 81.9 /100 | #126 | Excellent 6.5% |
| Dutch | 80.6 /100 | #127 | Excellent 6.5% |
| Immigrants | Chile | 80.5 /100 | #128 | Excellent 6.5% |
| Sri Lankans | 80.3 /100 | #129 | Excellent 6.5% |
| Immigrants | Peru | 79.9 /100 | #130 | Good 6.5% |
| Immigrants | Afghanistan | 79.2 /100 | #131 | Good 6.5% |
| Poles | 76.6 /100 | #132 | Good 6.5% |
| Immigrants | Europe | 75.7 /100 | #133 | Good 6.5% |
| Immigrants | Vietnam | 75.6 /100 | #134 | Good 6.5% |
| Immigrants | Croatia | 75.5 /100 | #135 | Good 6.5% |
| Northern Europeans | 75.4 /100 | #136 | Good 6.5% |
Demographics Similar to Somalis by Unemployment Among Ages 25 to 29 years
In terms of unemployment among ages 25 to 29 years, the demographic groups most similar to Somalis are Immigrants from Cuba (5.6%, a difference of 0.060%), Hmong (5.7%, a difference of 0.19%), Immigrants from India (5.7%, a difference of 0.27%), Immigrants from Bosnia and Herzegovina (5.7%, a difference of 0.39%), and Immigrants from Nepal (5.7%, a difference of 1.7%).
| Demographics | Rating | Rank | Unemployment Among Ages 25 to 29 years |
| Sudanese | 100.0 /100 | #1 | Exceptional 5.4% |
| Tongans | 100.0 /100 | #2 | Exceptional 5.5% |
| Immigrants | Somalia | 100.0 /100 | #3 | Exceptional 5.5% |
| Immigrants | Cuba | 100.0 /100 | #4 | Exceptional 5.6% |
| Somalis | 100.0 /100 | #5 | Exceptional 5.6% |
| Hmong | 100.0 /100 | #6 | Exceptional 5.7% |
| Immigrants | India | 100.0 /100 | #7 | Exceptional 5.7% |
| Immigrants | Bosnia and Herzegovina | 100.0 /100 | #8 | Exceptional 5.7% |
| Immigrants | Nepal | 100.0 /100 | #9 | Exceptional 5.7% |
| Immigrants | Sudan | 100.0 /100 | #10 | Exceptional 5.8% |
| Cambodians | 100.0 /100 | #11 | Exceptional 5.8% |
| Okinawans | 100.0 /100 | #12 | Exceptional 5.9% |
| Immigrants | Bolivia | 100.0 /100 | #13 | Exceptional 5.9% |
| Immigrants | Kuwait | 99.9 /100 | #14 | Exceptional 5.9% |
| Cubans | 99.9 /100 | #15 | Exceptional 5.9% |