Sri Lankan vs Immigrants from Germany Unemployment Among Ages 65 to 74 years
COMPARE
Sri Lankan
Immigrants from Germany
Unemployment Among Ages 65 to 74 years
Unemployment Among Ages 65 to 74 years Comparison
Sri Lankans
Immigrants from Germany
5.3%
UNEMPLOYMENT AMONG AGES 65 TO 74 YEARS
92.7/ 100
METRIC RATING
111th/ 347
METRIC RANK
5.3%
UNEMPLOYMENT AMONG AGES 65 TO 74 YEARS
91.6/ 100
METRIC RATING
113th/ 347
METRIC RANK
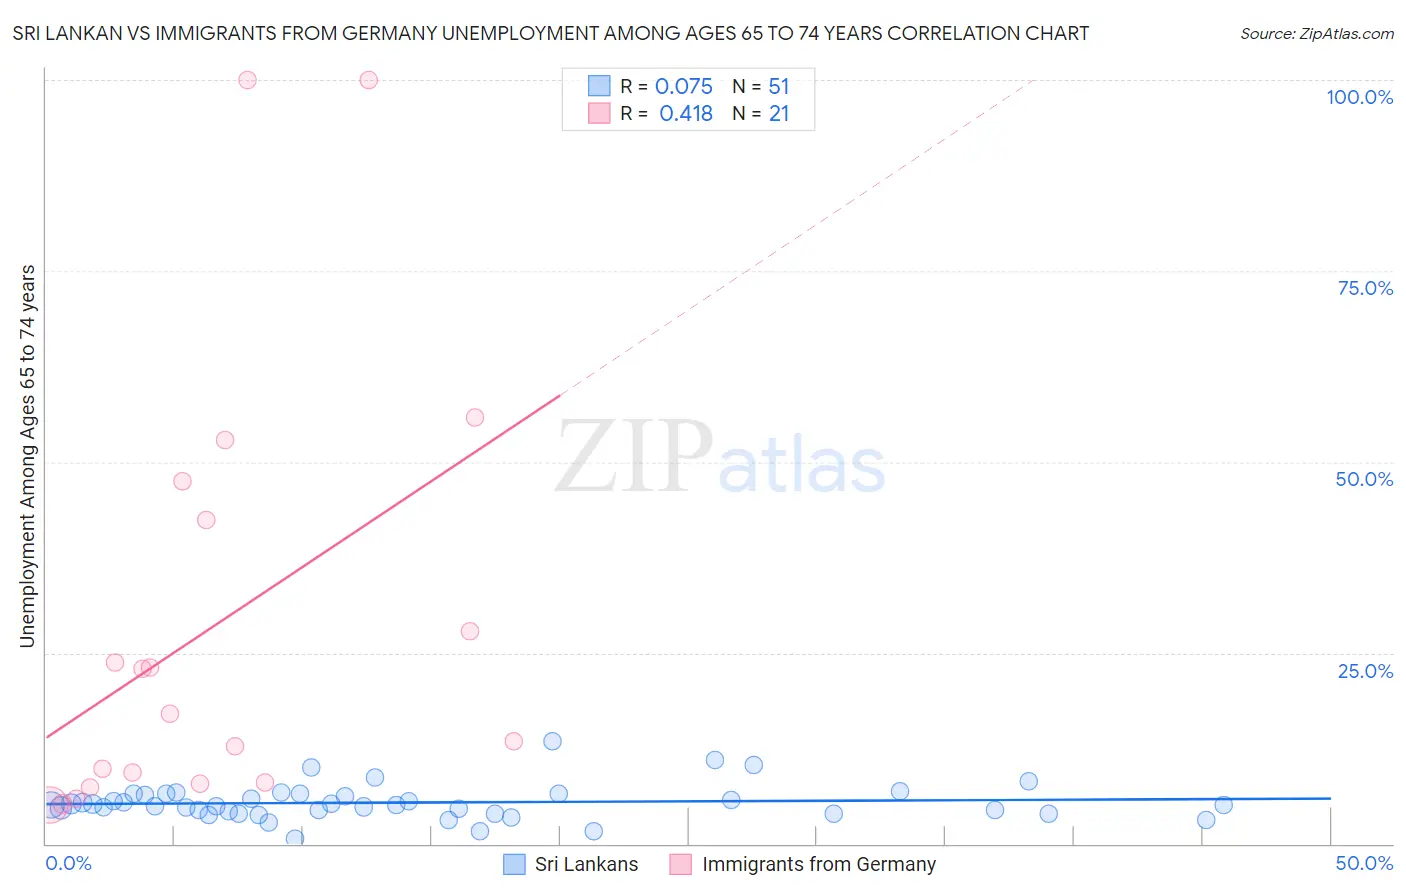
Sri Lankan vs Immigrants from Germany Unemployment Among Ages 65 to 74 years Correlation Chart
The statistical analysis conducted on geographies consisting of 381,689,820 people shows a slight positive correlation between the proportion of Sri Lankans and unemployment rate among population between the ages 65 and 74 in the United States with a correlation coefficient (R) of 0.075 and weighted average of 5.3%. Similarly, the statistical analysis conducted on geographies consisting of 394,768,450 people shows a moderate positive correlation between the proportion of Immigrants from Germany and unemployment rate among population between the ages 65 and 74 in the United States with a correlation coefficient (R) of 0.418 and weighted average of 5.3%, a difference of 0.13%.
Unemployment Among Ages 65 to 74 years Correlation Summary
| Measurement | Sri Lankan | Immigrants from Germany |
| Minimum | 0.60% | 5.1% |
| Maximum | 13.4% | 100.0% |
| Range | 12.8% | 94.9% |
| Mean | 5.4% | 28.5% |
| Median | 5.1% | 17.0% |
| Interquartile 25% (IQ1) | 3.9% | 8.0% |
| Interquartile 75% (IQ3) | 6.5% | 44.9% |
| Interquartile Range (IQR) | 2.6% | 37.0% |
| Standard Deviation (Sample) | 2.3% | 28.7% |
| Standard Deviation (Population) | 2.3% | 28.0% |
Demographics Similar to Sri Lankans and Immigrants from Germany by Unemployment Among Ages 65 to 74 years
In terms of unemployment among ages 65 to 74 years, the demographic groups most similar to Sri Lankans are Immigrants from South Central Asia (5.3%, a difference of 0.040%), Immigrants from Bolivia (5.2%, a difference of 0.11%), Immigrants from Singapore (5.2%, a difference of 0.16%), Immigrants from Malaysia (5.2%, a difference of 0.19%), and Asian (5.3%, a difference of 0.19%). Similarly, the demographic groups most similar to Immigrants from Germany are Asian (5.3%, a difference of 0.050%), Immigrants from Turkey (5.3%, a difference of 0.080%), Immigrants from South Central Asia (5.3%, a difference of 0.090%), Australian (5.3%, a difference of 0.12%), and Immigrants from Korea (5.3%, a difference of 0.14%).
| Demographics | Rating | Rank | Unemployment Among Ages 65 to 74 years |
| Immigrants | Lithuania | 95.9 /100 | #102 | Exceptional 5.2% |
| Immigrants | Vietnam | 95.6 /100 | #103 | Exceptional 5.2% |
| Yugoslavians | 95.5 /100 | #104 | Exceptional 5.2% |
| Iranians | 95.2 /100 | #105 | Exceptional 5.2% |
| Malaysians | 95.1 /100 | #106 | Exceptional 5.2% |
| Austrians | 94.5 /100 | #107 | Exceptional 5.2% |
| Immigrants | Malaysia | 94.1 /100 | #108 | Exceptional 5.2% |
| Immigrants | Singapore | 93.9 /100 | #109 | Exceptional 5.2% |
| Immigrants | Bolivia | 93.6 /100 | #110 | Exceptional 5.2% |
| Sri Lankans | 92.7 /100 | #111 | Exceptional 5.3% |
| Immigrants | South Central Asia | 92.4 /100 | #112 | Exceptional 5.3% |
| Immigrants | Germany | 91.6 /100 | #113 | Exceptional 5.3% |
| Asians | 91.1 /100 | #114 | Exceptional 5.3% |
| Immigrants | Turkey | 90.8 /100 | #115 | Exceptional 5.3% |
| Australians | 90.4 /100 | #116 | Exceptional 5.3% |
| Immigrants | Korea | 90.2 /100 | #117 | Exceptional 5.3% |
| Immigrants | Belarus | 90.1 /100 | #118 | Exceptional 5.3% |
| Immigrants | Fiji | 89.9 /100 | #119 | Excellent 5.3% |
| Immigrants | Switzerland | 89.9 /100 | #120 | Excellent 5.3% |
| Immigrants | Australia | 89.1 /100 | #121 | Excellent 5.3% |
| Immigrants | Canada | 89.0 /100 | #122 | Excellent 5.3% |