Sri Lankan vs Burmese Unemployment Among Ages 35 to 44 years
COMPARE
Sri Lankan
Burmese
Unemployment Among Ages 35 to 44 years
Unemployment Among Ages 35 to 44 years Comparison
Sri Lankans
Burmese
4.5%
UNEMPLOYMENT AMONG AGES 35 TO 44 YEARS
86.8/ 100
METRIC RATING
122nd/ 347
METRIC RANK
4.3%
UNEMPLOYMENT AMONG AGES 35 TO 44 YEARS
98.9/ 100
METRIC RATING
38th/ 347
METRIC RANK
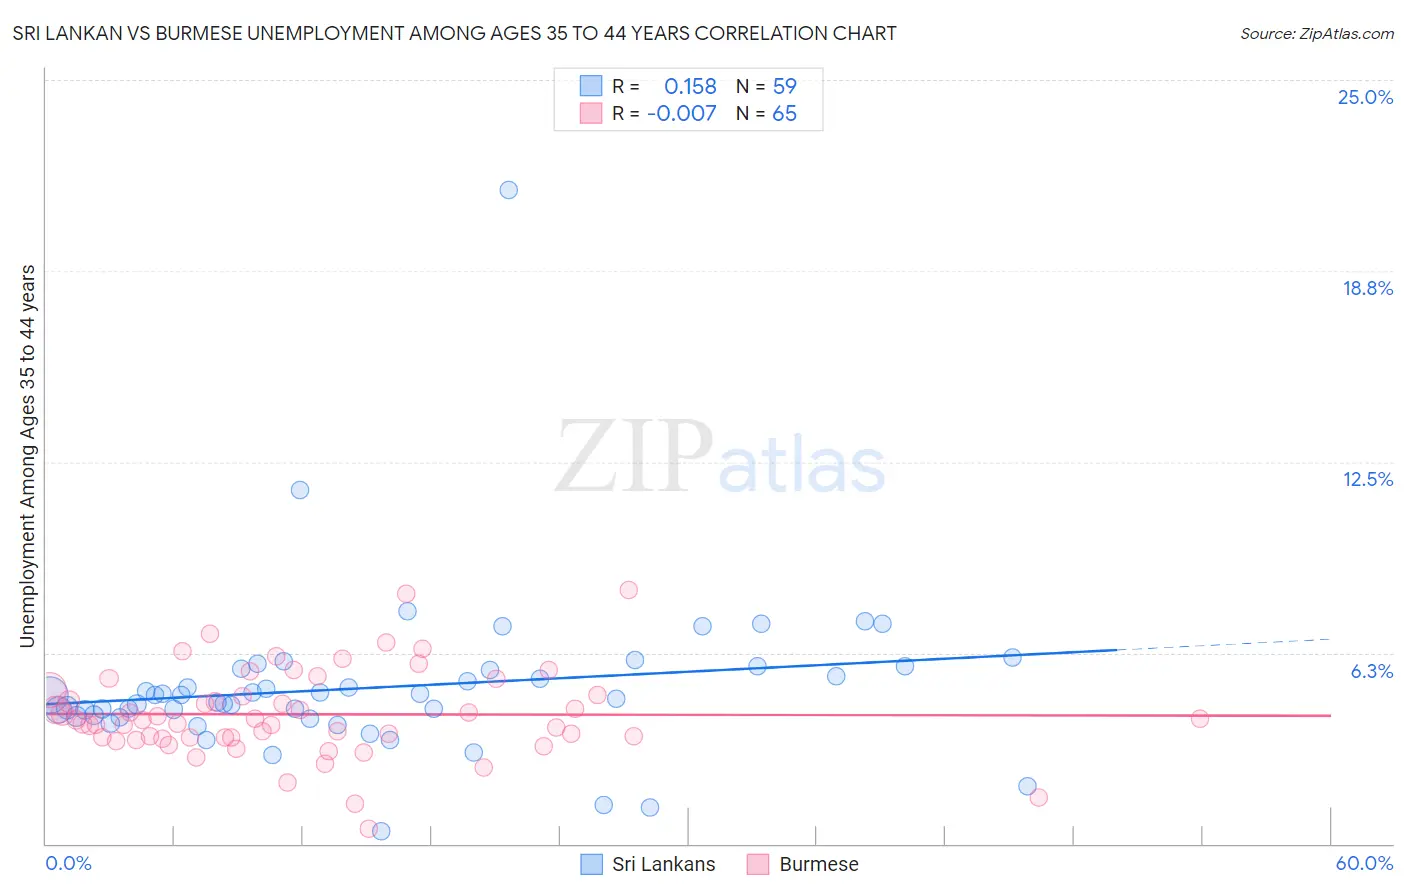
Sri Lankan vs Burmese Unemployment Among Ages 35 to 44 years Correlation Chart
The statistical analysis conducted on geographies consisting of 429,668,170 people shows a poor positive correlation between the proportion of Sri Lankans and unemployment rate among population between the ages 35 and 44 in the United States with a correlation coefficient (R) of 0.158 and weighted average of 4.5%. Similarly, the statistical analysis conducted on geographies consisting of 451,120,680 people shows no correlation between the proportion of Burmese and unemployment rate among population between the ages 35 and 44 in the United States with a correlation coefficient (R) of -0.007 and weighted average of 4.3%, a difference of 5.0%.
Unemployment Among Ages 35 to 44 years Correlation Summary
| Measurement | Sri Lankan | Burmese |
| Minimum | 0.40% | 0.50% |
| Maximum | 21.4% | 8.3% |
| Range | 21.0% | 7.8% |
| Mean | 5.1% | 4.2% |
| Median | 4.9% | 4.0% |
| Interquartile 25% (IQ1) | 4.2% | 3.5% |
| Interquartile 75% (IQ3) | 5.7% | 4.9% |
| Interquartile Range (IQR) | 1.6% | 1.5% |
| Standard Deviation (Sample) | 2.7% | 1.4% |
| Standard Deviation (Population) | 2.7% | 1.4% |
Similar Demographics by Unemployment Among Ages 35 to 44 years
Demographics Similar to Sri Lankans by Unemployment Among Ages 35 to 44 years
In terms of unemployment among ages 35 to 44 years, the demographic groups most similar to Sri Lankans are Immigrants from South Africa (4.5%, a difference of 0.0%), Ethiopian (4.5%, a difference of 0.050%), Basque (4.5%, a difference of 0.080%), Immigrants from Spain (4.5%, a difference of 0.11%), and Immigrants from Northern Africa (4.5%, a difference of 0.11%).
| Demographics | Rating | Rank | Unemployment Among Ages 35 to 44 years |
| Maltese | 88.1 /100 | #115 | Excellent 4.5% |
| Immigrants | Israel | 88.1 /100 | #116 | Excellent 4.5% |
| Immigrants | Greece | 87.9 /100 | #117 | Excellent 4.5% |
| Irish | 87.9 /100 | #118 | Excellent 4.5% |
| Nicaraguans | 87.6 /100 | #119 | Excellent 4.5% |
| Ethiopians | 87.1 /100 | #120 | Excellent 4.5% |
| Immigrants | South Africa | 86.8 /100 | #121 | Excellent 4.5% |
| Sri Lankans | 86.8 /100 | #122 | Excellent 4.5% |
| Basques | 86.3 /100 | #123 | Excellent 4.5% |
| Immigrants | Spain | 86.1 /100 | #124 | Excellent 4.5% |
| Immigrants | Northern Africa | 86.1 /100 | #125 | Excellent 4.5% |
| Immigrants | Austria | 84.7 /100 | #126 | Excellent 4.5% |
| Immigrants | Ethiopia | 84.7 /100 | #127 | Excellent 4.5% |
| Czechoslovakians | 83.4 /100 | #128 | Excellent 4.6% |
| Immigrants | Croatia | 83.1 /100 | #129 | Excellent 4.6% |
Demographics Similar to Burmese by Unemployment Among Ages 35 to 44 years
In terms of unemployment among ages 35 to 44 years, the demographic groups most similar to Burmese are Palestinian (4.3%, a difference of 0.060%), Immigrants from Zimbabwe (4.3%, a difference of 0.070%), Zimbabwean (4.3%, a difference of 0.11%), Mongolian (4.3%, a difference of 0.12%), and Belgian (4.3%, a difference of 0.21%).
| Demographics | Rating | Rank | Unemployment Among Ages 35 to 44 years |
| Carpatho Rusyns | 99.2 /100 | #31 | Exceptional 4.3% |
| Chinese | 99.1 /100 | #32 | Exceptional 4.3% |
| Immigrants | Sri Lanka | 99.1 /100 | #33 | Exceptional 4.3% |
| Jordanians | 99.0 /100 | #34 | Exceptional 4.3% |
| Luxembourgers | 99.0 /100 | #35 | Exceptional 4.3% |
| Mongolians | 98.9 /100 | #36 | Exceptional 4.3% |
| Immigrants | Zimbabwe | 98.9 /100 | #37 | Exceptional 4.3% |
| Burmese | 98.9 /100 | #38 | Exceptional 4.3% |
| Palestinians | 98.8 /100 | #39 | Exceptional 4.3% |
| Zimbabweans | 98.8 /100 | #40 | Exceptional 4.3% |
| Belgians | 98.7 /100 | #41 | Exceptional 4.3% |
| Germans | 98.7 /100 | #42 | Exceptional 4.3% |
| Eastern Europeans | 98.7 /100 | #43 | Exceptional 4.3% |
| Immigrants | Malaysia | 98.7 /100 | #44 | Exceptional 4.3% |
| Immigrants | Korea | 98.4 /100 | #45 | Exceptional 4.3% |