Spanish vs Immigrants from Iraq Unemployment Among Seniors over 65 years
COMPARE
Spanish
Immigrants from Iraq
Unemployment Among Seniors over 65 years
Unemployment Among Seniors over 65 years Comparison
Spanish
Immigrants from Iraq
5.1%
UNEMPLOYMENT AMONG SENIORS OVER 65 YEARS
78.8/ 100
METRIC RATING
145th/ 347
METRIC RANK
4.9%
UNEMPLOYMENT AMONG SENIORS OVER 65 YEARS
99.8/ 100
METRIC RATING
54th/ 347
METRIC RANK
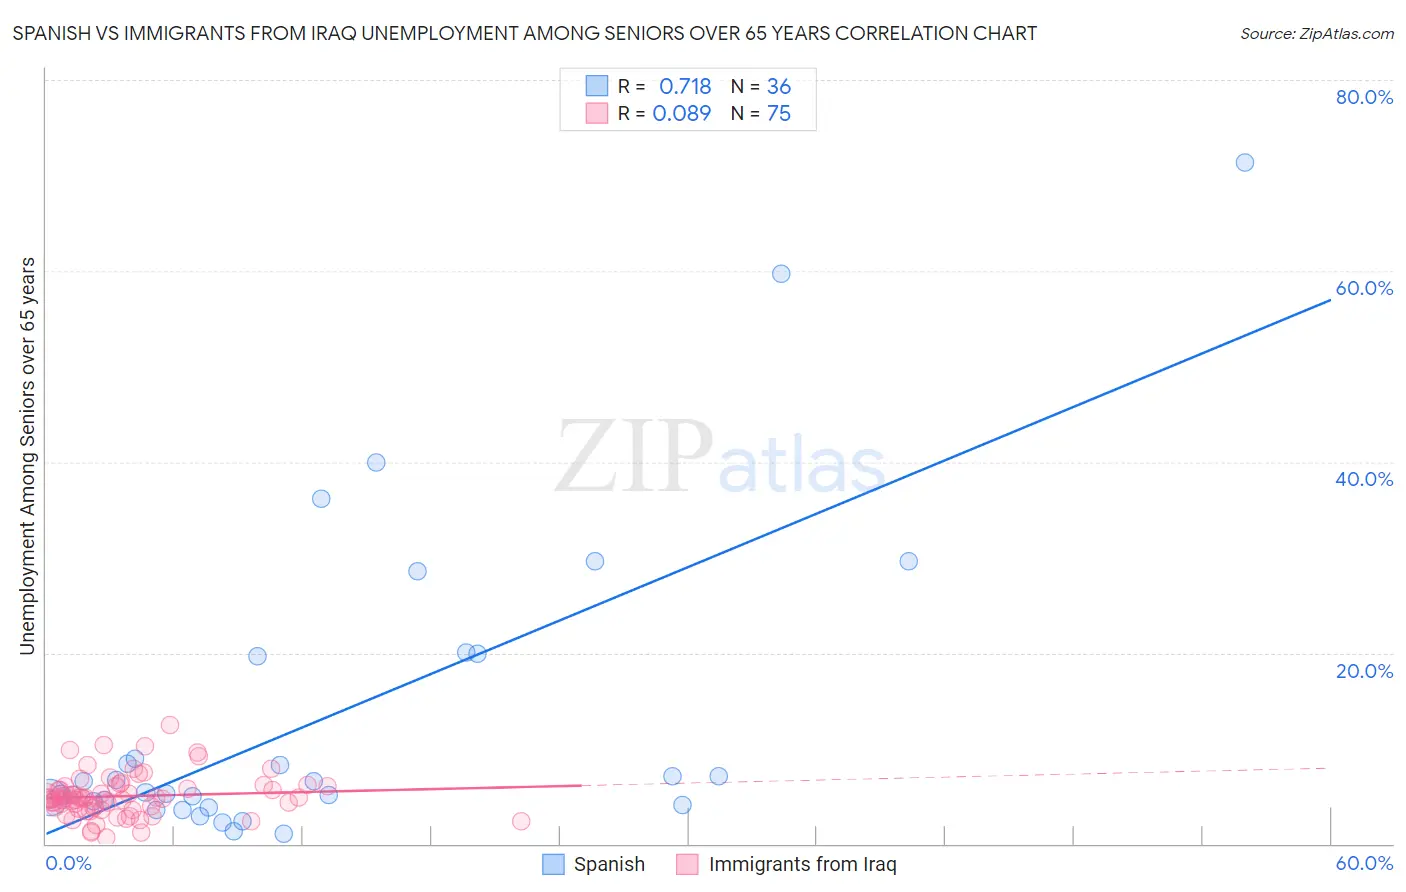
Spanish vs Immigrants from Iraq Unemployment Among Seniors over 65 years Correlation Chart
The statistical analysis conducted on geographies consisting of 376,201,683 people shows a strong positive correlation between the proportion of Spanish and unemployment rate amomg seniors over the age of 65 in the United States with a correlation coefficient (R) of 0.718 and weighted average of 5.1%. Similarly, the statistical analysis conducted on geographies consisting of 186,076,172 people shows a slight positive correlation between the proportion of Immigrants from Iraq and unemployment rate amomg seniors over the age of 65 in the United States with a correlation coefficient (R) of 0.089 and weighted average of 4.9%, a difference of 4.3%.
Unemployment Among Seniors over 65 years Correlation Summary
| Measurement | Spanish | Immigrants from Iraq |
| Minimum | 1.1% | 0.60% |
| Maximum | 71.3% | 12.5% |
| Range | 70.2% | 11.9% |
| Mean | 13.4% | 5.0% |
| Median | 6.0% | 4.7% |
| Interquartile 25% (IQ1) | 4.2% | 3.6% |
| Interquartile 75% (IQ3) | 19.8% | 6.0% |
| Interquartile Range (IQR) | 15.6% | 2.4% |
| Standard Deviation (Sample) | 16.5% | 2.3% |
| Standard Deviation (Population) | 16.3% | 2.2% |
Similar Demographics by Unemployment Among Seniors over 65 years
Demographics Similar to Spanish by Unemployment Among Seniors over 65 years
In terms of unemployment among seniors over 65 years, the demographic groups most similar to Spanish are Immigrants from Russia (5.1%, a difference of 0.010%), Slovak (5.1%, a difference of 0.050%), Polish (5.1%, a difference of 0.070%), Senegalese (5.1%, a difference of 0.080%), and Greek (5.1%, a difference of 0.090%).
| Demographics | Rating | Rank | Unemployment Among Seniors over 65 years |
| New Zealanders | 83.2 /100 | #138 | Excellent 5.1% |
| Immigrants | Panama | 83.0 /100 | #139 | Excellent 5.1% |
| Immigrants | Chile | 83.0 /100 | #140 | Excellent 5.1% |
| Cherokee | 81.6 /100 | #141 | Excellent 5.1% |
| Immigrants | Indonesia | 81.0 /100 | #142 | Excellent 5.1% |
| Senegalese | 80.4 /100 | #143 | Excellent 5.1% |
| Poles | 80.3 /100 | #144 | Excellent 5.1% |
| Spanish | 78.8 /100 | #145 | Good 5.1% |
| Immigrants | Russia | 78.5 /100 | #146 | Good 5.1% |
| Slovaks | 77.9 /100 | #147 | Good 5.1% |
| Greeks | 77.0 /100 | #148 | Good 5.1% |
| Immigrants | Afghanistan | 76.8 /100 | #149 | Good 5.1% |
| Immigrants | Asia | 75.6 /100 | #150 | Good 5.1% |
| Pakistanis | 75.5 /100 | #151 | Good 5.1% |
| Canadians | 74.7 /100 | #152 | Good 5.1% |
Demographics Similar to Immigrants from Iraq by Unemployment Among Seniors over 65 years
In terms of unemployment among seniors over 65 years, the demographic groups most similar to Immigrants from Iraq are European (4.9%, a difference of 0.010%), Immigrants from Sudan (4.9%, a difference of 0.060%), Carpatho Rusyn (4.9%, a difference of 0.070%), Swedish (4.9%, a difference of 0.10%), and Danish (4.9%, a difference of 0.11%).
| Demographics | Rating | Rank | Unemployment Among Seniors over 65 years |
| Germans | 99.9 /100 | #47 | Exceptional 4.9% |
| Choctaw | 99.9 /100 | #48 | Exceptional 4.9% |
| Immigrants | Kenya | 99.9 /100 | #49 | Exceptional 4.9% |
| Immigrants | Austria | 99.9 /100 | #50 | Exceptional 4.9% |
| Scotch-Irish | 99.9 /100 | #51 | Exceptional 4.9% |
| Swedes | 99.9 /100 | #52 | Exceptional 4.9% |
| Immigrants | Sudan | 99.8 /100 | #53 | Exceptional 4.9% |
| Immigrants | Iraq | 99.8 /100 | #54 | Exceptional 4.9% |
| Europeans | 99.8 /100 | #55 | Exceptional 4.9% |
| Carpatho Rusyns | 99.8 /100 | #56 | Exceptional 4.9% |
| Danes | 99.8 /100 | #57 | Exceptional 4.9% |
| Scandinavians | 99.8 /100 | #58 | Exceptional 4.9% |
| Immigrants | Eastern Africa | 99.7 /100 | #59 | Exceptional 4.9% |
| Immigrants | Middle Africa | 99.7 /100 | #60 | Exceptional 4.9% |
| Northern Europeans | 99.7 /100 | #61 | Exceptional 4.9% |