Spanish vs Immigrants from Africa Unemployment Among Ages 60 to 64 years
COMPARE
Spanish
Immigrants from Africa
Unemployment Among Ages 60 to 64 years
Unemployment Among Ages 60 to 64 years Comparison
Spanish
Immigrants from Africa
4.8%
UNEMPLOYMENT AMONG AGES 60 TO 64 YEARS
65.5/ 100
METRIC RATING
159th/ 347
METRIC RANK
4.8%
UNEMPLOYMENT AMONG AGES 60 TO 64 YEARS
86.6/ 100
METRIC RATING
139th/ 347
METRIC RANK
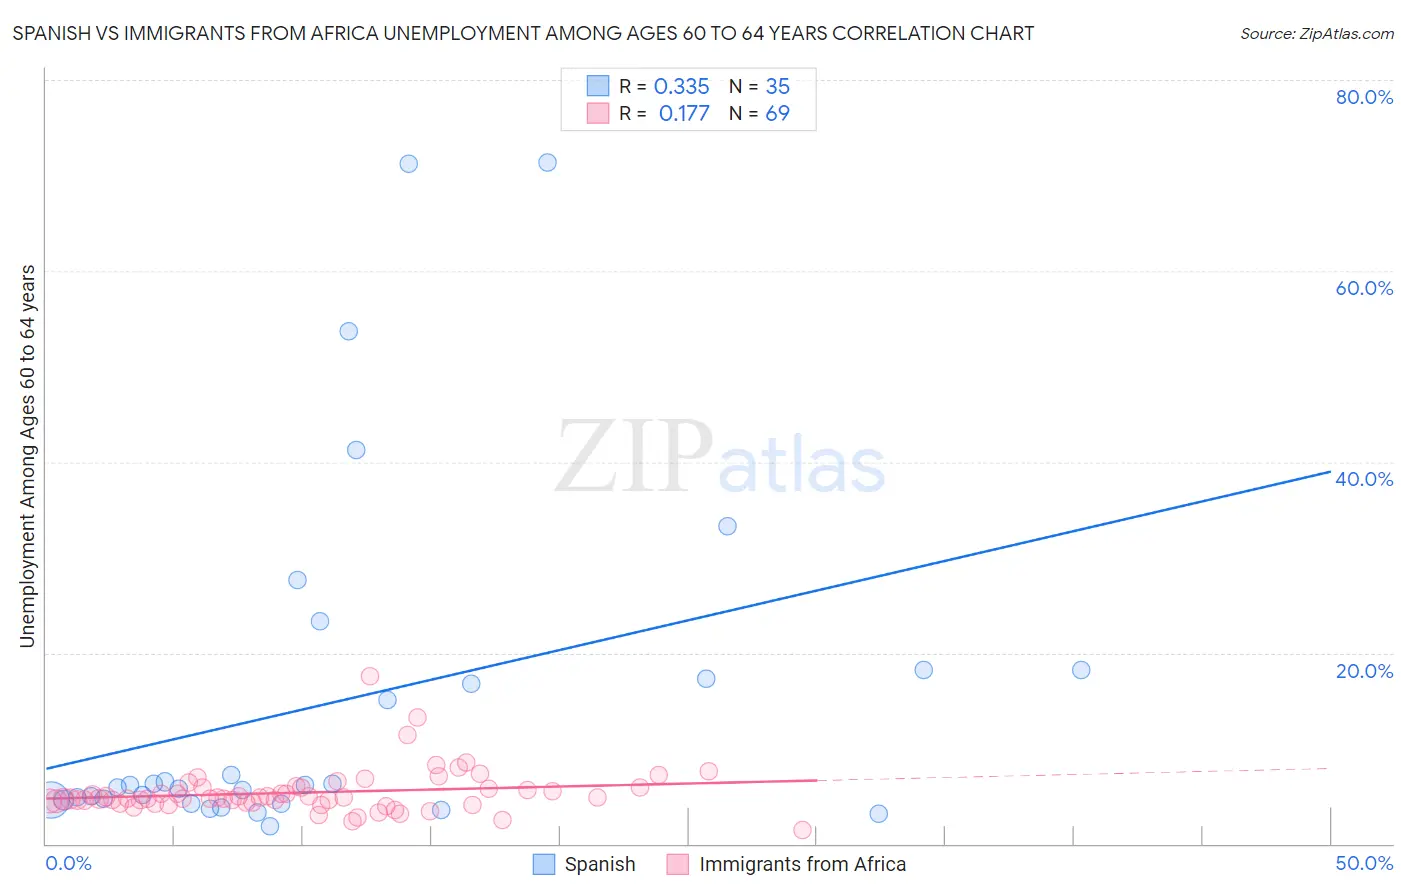
Spanish vs Immigrants from Africa Unemployment Among Ages 60 to 64 years Correlation Chart
The statistical analysis conducted on geographies consisting of 378,454,425 people shows a mild positive correlation between the proportion of Spanish and unemployment rate among population between the ages 60 and 64 in the United States with a correlation coefficient (R) of 0.335 and weighted average of 4.8%. Similarly, the statistical analysis conducted on geographies consisting of 415,462,067 people shows a poor positive correlation between the proportion of Immigrants from Africa and unemployment rate among population between the ages 60 and 64 in the United States with a correlation coefficient (R) of 0.177 and weighted average of 4.8%, a difference of 1.1%.
Unemployment Among Ages 60 to 64 years Correlation Summary
| Measurement | Spanish | Immigrants from Africa |
| Minimum | 1.9% | 1.4% |
| Maximum | 71.4% | 17.5% |
| Range | 69.5% | 16.1% |
| Mean | 14.8% | 5.4% |
| Median | 6.1% | 4.7% |
| Interquartile 25% (IQ1) | 4.6% | 4.3% |
| Interquartile 75% (IQ3) | 18.2% | 5.9% |
| Interquartile Range (IQR) | 13.6% | 1.5% |
| Standard Deviation (Sample) | 18.4% | 2.4% |
| Standard Deviation (Population) | 18.1% | 2.4% |
Demographics Similar to Spanish and Immigrants from Africa by Unemployment Among Ages 60 to 64 years
In terms of unemployment among ages 60 to 64 years, the demographic groups most similar to Spanish are Immigrants from Taiwan (4.8%, a difference of 0.020%), Laotian (4.8%, a difference of 0.050%), Immigrants from Bolivia (4.8%, a difference of 0.15%), Filipino (4.8%, a difference of 0.27%), and Chilean (4.8%, a difference of 0.30%). Similarly, the demographic groups most similar to Immigrants from Africa are Pima (4.8%, a difference of 0.060%), Panamanian (4.8%, a difference of 0.090%), Immigrants from Ethiopia (4.8%, a difference of 0.10%), Italian (4.8%, a difference of 0.12%), and Immigrants from Pakistan (4.8%, a difference of 0.24%).
| Demographics | Rating | Rank | Unemployment Among Ages 60 to 64 years |
| Immigrants | Africa | 86.6 /100 | #139 | Excellent 4.8% |
| Pima | 85.8 /100 | #140 | Excellent 4.8% |
| Panamanians | 85.5 /100 | #141 | Excellent 4.8% |
| Immigrants | Ethiopia | 85.3 /100 | #142 | Excellent 4.8% |
| Italians | 85.0 /100 | #143 | Excellent 4.8% |
| Immigrants | Pakistan | 83.3 /100 | #144 | Excellent 4.8% |
| Burmese | 83.1 /100 | #145 | Excellent 4.8% |
| Turks | 81.9 /100 | #146 | Excellent 4.8% |
| Mongolians | 81.2 /100 | #147 | Excellent 4.8% |
| Latvians | 79.1 /100 | #148 | Good 4.8% |
| Arabs | 78.8 /100 | #149 | Good 4.8% |
| Immigrants | Italy | 78.7 /100 | #150 | Good 4.8% |
| Immigrants | South Africa | 78.5 /100 | #151 | Good 4.8% |
| Americans | 75.7 /100 | #152 | Good 4.8% |
| Bolivians | 75.5 /100 | #153 | Good 4.8% |
| Chileans | 72.6 /100 | #154 | Good 4.8% |
| Filipinos | 72.1 /100 | #155 | Good 4.8% |
| Immigrants | Bolivia | 69.2 /100 | #156 | Good 4.8% |
| Laotians | 66.8 /100 | #157 | Good 4.8% |
| Immigrants | Taiwan | 66.0 /100 | #158 | Good 4.8% |
| Spanish | 65.5 /100 | #159 | Good 4.8% |