Spanish vs Hungarian Unemployment Among Ages 25 to 29 years
COMPARE
Spanish
Hungarian
Unemployment Among Ages 25 to 29 years
Unemployment Among Ages 25 to 29 years Comparison
Spanish
Hungarians
6.8%
UNEMPLOYMENT AMONG AGES 25 TO 29 YEARS
14.4/ 100
METRIC RATING
215th/ 347
METRIC RANK
6.8%
UNEMPLOYMENT AMONG AGES 25 TO 29 YEARS
26.8/ 100
METRIC RATING
196th/ 347
METRIC RANK
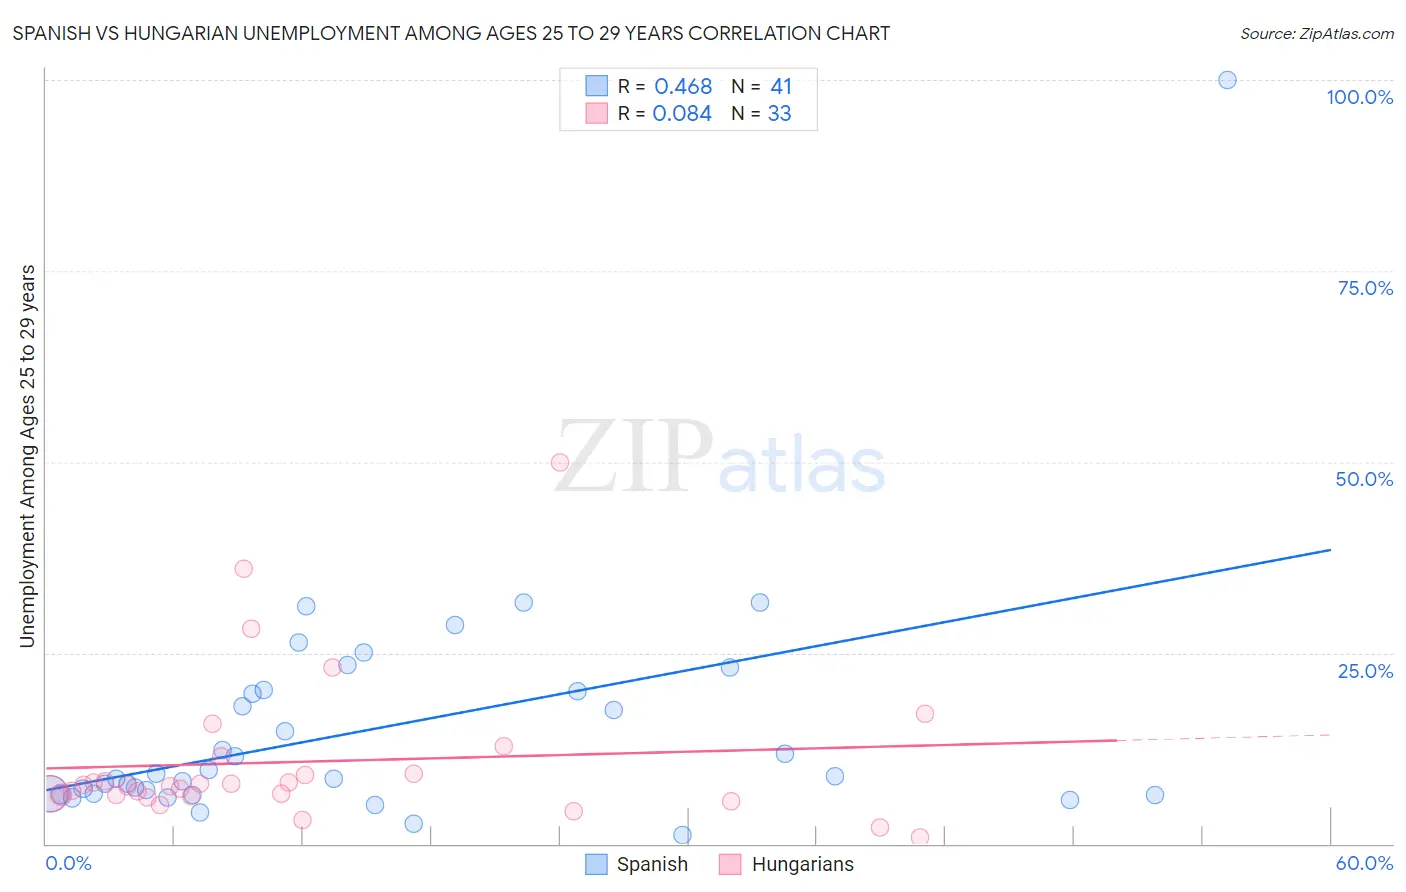
Spanish vs Hungarian Unemployment Among Ages 25 to 29 years Correlation Chart
The statistical analysis conducted on geographies consisting of 399,195,513 people shows a moderate positive correlation between the proportion of Spanish and unemployment rate among population between the ages 25 and 29 in the United States with a correlation coefficient (R) of 0.468 and weighted average of 6.8%. Similarly, the statistical analysis conducted on geographies consisting of 447,409,304 people shows a slight positive correlation between the proportion of Hungarians and unemployment rate among population between the ages 25 and 29 in the United States with a correlation coefficient (R) of 0.084 and weighted average of 6.8%, a difference of 1.2%.
Unemployment Among Ages 25 to 29 years Correlation Summary
| Measurement | Spanish | Hungarian |
| Minimum | 1.1% | 0.80% |
| Maximum | 100.0% | 50.0% |
| Range | 98.9% | 49.2% |
| Mean | 15.1% | 10.8% |
| Median | 8.9% | 7.6% |
| Interquartile 25% (IQ1) | 6.5% | 6.3% |
| Interquartile 75% (IQ3) | 20.0% | 10.3% |
| Interquartile Range (IQR) | 13.5% | 4.0% |
| Standard Deviation (Sample) | 16.1% | 10.1% |
| Standard Deviation (Population) | 15.9% | 10.0% |
Demographics Similar to Spanish and Hungarians by Unemployment Among Ages 25 to 29 years
In terms of unemployment among ages 25 to 29 years, the demographic groups most similar to Spanish are Liberian (6.8%, a difference of 0.030%), Immigrants from Syria (6.8%, a difference of 0.080%), Immigrants from Cabo Verde (6.8%, a difference of 0.20%), Immigrants from Philippines (6.8%, a difference of 0.25%), and Canadian (6.8%, a difference of 0.28%). Similarly, the demographic groups most similar to Hungarians are Italian (6.8%, a difference of 0.020%), Immigrants from Western Asia (6.7%, a difference of 0.040%), Immigrants from Southern Europe (6.8%, a difference of 0.18%), Guamanian/Chamorro (6.8%, a difference of 0.20%), and South American Indian (6.8%, a difference of 0.28%).
| Demographics | Rating | Rank | Unemployment Among Ages 25 to 29 years |
| Immigrants | Western Asia | 27.3 /100 | #195 | Fair 6.7% |
| Hungarians | 26.8 /100 | #196 | Fair 6.8% |
| Italians | 26.5 /100 | #197 | Fair 6.8% |
| Immigrants | Southern Europe | 24.6 /100 | #198 | Fair 6.8% |
| Guamanians/Chamorros | 24.3 /100 | #199 | Fair 6.8% |
| South American Indians | 23.3 /100 | #200 | Fair 6.8% |
| Basques | 22.5 /100 | #201 | Fair 6.8% |
| Immigrants | Argentina | 21.6 /100 | #202 | Fair 6.8% |
| Immigrants | Norway | 21.2 /100 | #203 | Fair 6.8% |
| Scotch-Irish | 20.0 /100 | #204 | Poor 6.8% |
| Immigrants | England | 19.8 /100 | #205 | Poor 6.8% |
| Ugandans | 19.8 /100 | #206 | Poor 6.8% |
| Immigrants | Denmark | 19.0 /100 | #207 | Poor 6.8% |
| Immigrants | Germany | 18.8 /100 | #208 | Poor 6.8% |
| Hawaiians | 17.1 /100 | #209 | Poor 6.8% |
| Canadians | 16.9 /100 | #210 | Poor 6.8% |
| Immigrants | Philippines | 16.7 /100 | #211 | Poor 6.8% |
| Immigrants | Cabo Verde | 16.2 /100 | #212 | Poor 6.8% |
| Immigrants | Syria | 15.1 /100 | #213 | Poor 6.8% |
| Liberians | 14.7 /100 | #214 | Poor 6.8% |
| Spanish | 14.4 /100 | #215 | Poor 6.8% |