Spanish American vs Immigrants from Jordan Unemployment Among Seniors over 75 years
COMPARE
Spanish American
Immigrants from Jordan
Unemployment Among Seniors over 75 years
Unemployment Among Seniors over 75 years Comparison
Spanish Americans
Immigrants from Jordan
8.0%
UNEMPLOYMENT AMONG SENIORS OVER 75 YEARS
99.8/ 100
METRIC RATING
74th/ 347
METRIC RANK
9.0%
UNEMPLOYMENT AMONG SENIORS OVER 75 YEARS
6.9/ 100
METRIC RATING
223rd/ 347
METRIC RANK
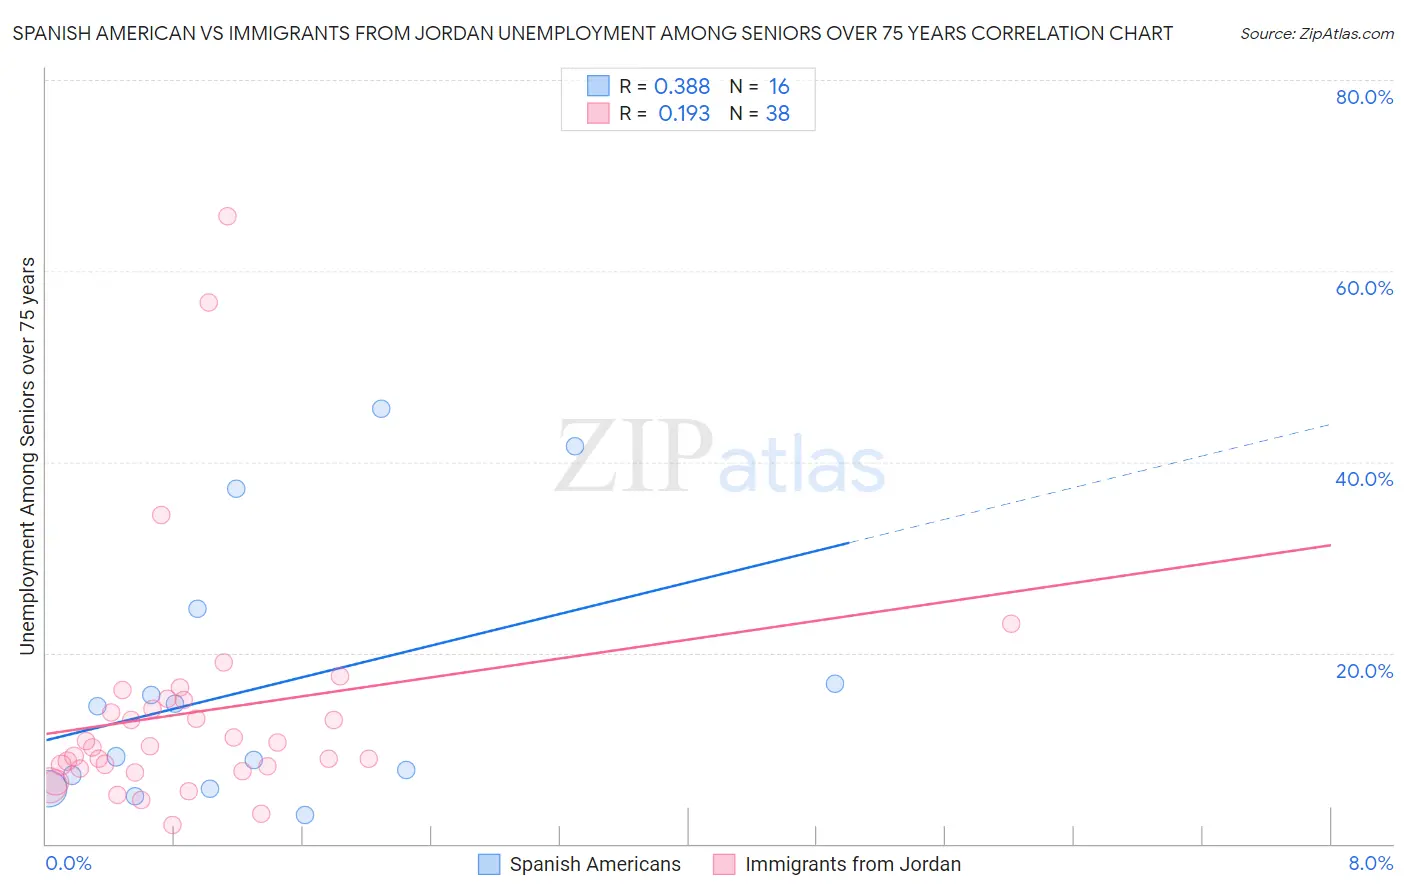
Spanish American vs Immigrants from Jordan Unemployment Among Seniors over 75 years Correlation Chart
The statistical analysis conducted on geographies consisting of 78,121,441 people shows a mild positive correlation between the proportion of Spanish Americans and unemployment rate among seniors over the age of 75 in the United States with a correlation coefficient (R) of 0.388 and weighted average of 8.0%. Similarly, the statistical analysis conducted on geographies consisting of 121,212,843 people shows a poor positive correlation between the proportion of Immigrants from Jordan and unemployment rate among seniors over the age of 75 in the United States with a correlation coefficient (R) of 0.193 and weighted average of 9.0%, a difference of 13.3%.
Unemployment Among Seniors over 75 years Correlation Summary
| Measurement | Spanish American | Immigrants from Jordan |
| Minimum | 3.0% | 2.0% |
| Maximum | 45.5% | 65.7% |
| Range | 42.5% | 63.7% |
| Mean | 16.4% | 13.8% |
| Median | 11.8% | 10.2% |
| Interquartile 25% (IQ1) | 6.5% | 7.9% |
| Interquartile 75% (IQ3) | 20.7% | 15.1% |
| Interquartile Range (IQR) | 14.2% | 7.2% |
| Standard Deviation (Sample) | 13.7% | 12.8% |
| Standard Deviation (Population) | 13.2% | 12.6% |
Similar Demographics by Unemployment Among Seniors over 75 years
Demographics Similar to Spanish Americans by Unemployment Among Seniors over 75 years
In terms of unemployment among seniors over 75 years, the demographic groups most similar to Spanish Americans are Immigrants from France (8.0%, a difference of 0.040%), Bolivian (8.0%, a difference of 0.090%), Immigrants from Cambodia (8.0%, a difference of 0.13%), Immigrants from Argentina (8.0%, a difference of 0.20%), and Indian (Asian) (8.0%, a difference of 0.27%).
| Demographics | Rating | Rank | Unemployment Among Seniors over 75 years |
| Immigrants | Syria | 99.9 /100 | #67 | Exceptional 8.0% |
| Immigrants | South Africa | 99.9 /100 | #68 | Exceptional 8.0% |
| Indians (Asian) | 99.9 /100 | #69 | Exceptional 8.0% |
| Immigrants | Argentina | 99.9 /100 | #70 | Exceptional 8.0% |
| Immigrants | Cambodia | 99.9 /100 | #71 | Exceptional 8.0% |
| Bolivians | 99.9 /100 | #72 | Exceptional 8.0% |
| Immigrants | France | 99.9 /100 | #73 | Exceptional 8.0% |
| Spanish Americans | 99.8 /100 | #74 | Exceptional 8.0% |
| Immigrants | Uganda | 99.8 /100 | #75 | Exceptional 8.0% |
| Immigrants | Venezuela | 99.8 /100 | #76 | Exceptional 8.0% |
| Immigrants | Turkey | 99.8 /100 | #77 | Exceptional 8.0% |
| Immigrants | Belarus | 99.8 /100 | #78 | Exceptional 8.0% |
| Immigrants | Japan | 99.7 /100 | #79 | Exceptional 8.0% |
| Immigrants | Australia | 99.7 /100 | #80 | Exceptional 8.0% |
| Cubans | 99.7 /100 | #81 | Exceptional 8.0% |
Demographics Similar to Immigrants from Jordan by Unemployment Among Seniors over 75 years
In terms of unemployment among seniors over 75 years, the demographic groups most similar to Immigrants from Jordan are Peruvian (9.0%, a difference of 0.070%), Guamanian/Chamorro (9.0%, a difference of 0.14%), Costa Rican (9.1%, a difference of 0.14%), Immigrants from Zimbabwe (9.0%, a difference of 0.16%), and Navajo (9.1%, a difference of 0.18%).
| Demographics | Rating | Rank | Unemployment Among Seniors over 75 years |
| Immigrants | Oceania | 11.8 /100 | #216 | Poor 9.0% |
| Lebanese | 11.1 /100 | #217 | Poor 9.0% |
| Immigrants | Africa | 9.7 /100 | #218 | Tragic 9.0% |
| Afghans | 8.3 /100 | #219 | Tragic 9.0% |
| Immigrants | Zimbabwe | 7.8 /100 | #220 | Tragic 9.0% |
| Guamanians/Chamorros | 7.7 /100 | #221 | Tragic 9.0% |
| Peruvians | 7.3 /100 | #222 | Tragic 9.0% |
| Immigrants | Jordan | 6.9 /100 | #223 | Tragic 9.0% |
| Costa Ricans | 6.3 /100 | #224 | Tragic 9.1% |
| Navajo | 6.1 /100 | #225 | Tragic 9.1% |
| Immigrants | Bangladesh | 5.9 /100 | #226 | Tragic 9.1% |
| Samoans | 5.7 /100 | #227 | Tragic 9.1% |
| Kenyans | 5.4 /100 | #228 | Tragic 9.1% |
| Hispanics or Latinos | 5.0 /100 | #229 | Tragic 9.1% |
| Northern Europeans | 4.9 /100 | #230 | Tragic 9.1% |