Spanish American Indian vs Hungarian Unemployment Among Ages 35 to 44 years
COMPARE
Spanish American Indian
Hungarian
Unemployment Among Ages 35 to 44 years
Unemployment Among Ages 35 to 44 years Comparison
Spanish American Indians
Hungarians
5.5%
UNEMPLOYMENT AMONG AGES 35 TO 44 YEARS
0.0/ 100
METRIC RATING
289th/ 347
METRIC RANK
4.6%
UNEMPLOYMENT AMONG AGES 35 TO 44 YEARS
62.6/ 100
METRIC RATING
160th/ 347
METRIC RANK
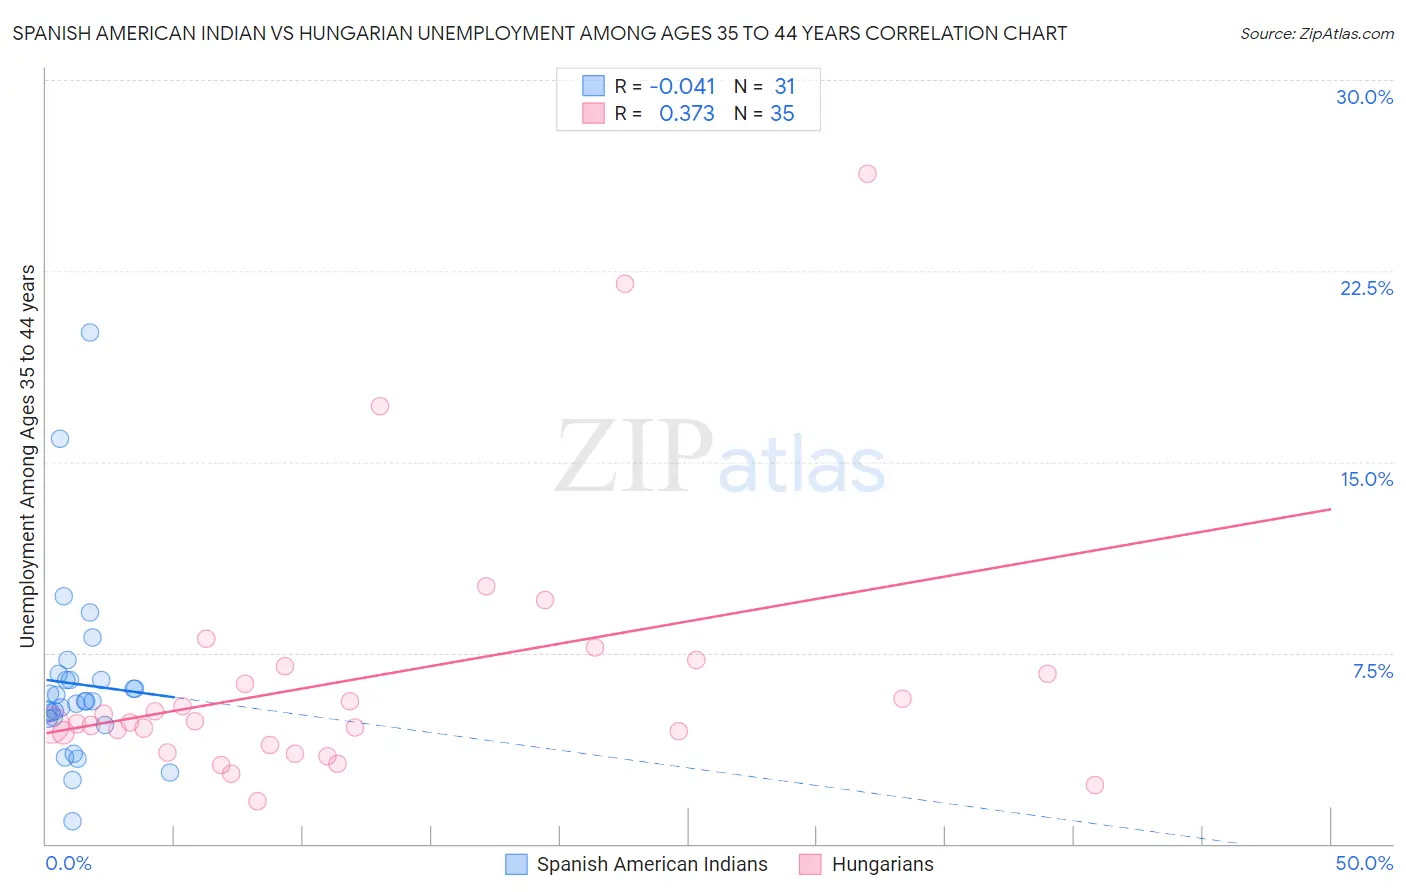
Spanish American Indian vs Hungarian Unemployment Among Ages 35 to 44 years Correlation Chart
The statistical analysis conducted on geographies consisting of 72,980,046 people shows no correlation between the proportion of Spanish American Indians and unemployment rate among population between the ages 35 and 44 in the United States with a correlation coefficient (R) of -0.041 and weighted average of 5.5%. Similarly, the statistical analysis conducted on geographies consisting of 465,604,082 people shows a mild positive correlation between the proportion of Hungarians and unemployment rate among population between the ages 35 and 44 in the United States with a correlation coefficient (R) of 0.373 and weighted average of 4.6%, a difference of 18.9%.
Unemployment Among Ages 35 to 44 years Correlation Summary
| Measurement | Spanish American Indian | Hungarian |
| Minimum | 0.90% | 1.7% |
| Maximum | 20.1% | 26.3% |
| Range | 19.2% | 24.6% |
| Mean | 6.3% | 6.5% |
| Median | 5.6% | 4.7% |
| Interquartile 25% (IQ1) | 4.9% | 3.9% |
| Interquartile 75% (IQ3) | 6.5% | 7.0% |
| Interquartile Range (IQR) | 1.5% | 3.1% |
| Standard Deviation (Sample) | 3.7% | 5.2% |
| Standard Deviation (Population) | 3.6% | 5.1% |
Similar Demographics by Unemployment Among Ages 35 to 44 years
Demographics Similar to Spanish American Indians by Unemployment Among Ages 35 to 44 years
In terms of unemployment among ages 35 to 44 years, the demographic groups most similar to Spanish American Indians are Jamaican (5.5%, a difference of 0.080%), Dutch West Indian (5.5%, a difference of 0.18%), Cree (5.5%, a difference of 0.34%), Immigrants from Haiti (5.5%, a difference of 0.34%), and French American Indian (5.5%, a difference of 0.49%).
| Demographics | Rating | Rank | Unemployment Among Ages 35 to 44 years |
| Immigrants | Ghana | 0.0 /100 | #282 | Tragic 5.4% |
| Immigrants | Ecuador | 0.0 /100 | #283 | Tragic 5.4% |
| Haitians | 0.0 /100 | #284 | Tragic 5.5% |
| Hispanics or Latinos | 0.0 /100 | #285 | Tragic 5.5% |
| Immigrants | Micronesia | 0.0 /100 | #286 | Tragic 5.5% |
| French American Indians | 0.0 /100 | #287 | Tragic 5.5% |
| Cree | 0.0 /100 | #288 | Tragic 5.5% |
| Spanish American Indians | 0.0 /100 | #289 | Tragic 5.5% |
| Jamaicans | 0.0 /100 | #290 | Tragic 5.5% |
| Dutch West Indians | 0.0 /100 | #291 | Tragic 5.5% |
| Immigrants | Haiti | 0.0 /100 | #292 | Tragic 5.5% |
| Central American Indians | 0.0 /100 | #293 | Tragic 5.6% |
| Trinidadians and Tobagonians | 0.0 /100 | #294 | Tragic 5.6% |
| Ottawa | 0.0 /100 | #295 | Tragic 5.6% |
| Immigrants | Trinidad and Tobago | 0.0 /100 | #296 | Tragic 5.6% |
Demographics Similar to Hungarians by Unemployment Among Ages 35 to 44 years
In terms of unemployment among ages 35 to 44 years, the demographic groups most similar to Hungarians are Albanian (4.6%, a difference of 0.030%), Immigrants from Iran (4.6%, a difference of 0.040%), Immigrants from Belarus (4.6%, a difference of 0.070%), Celtic (4.7%, a difference of 0.070%), and South American (4.6%, a difference of 0.090%).
| Demographics | Rating | Rank | Unemployment Among Ages 35 to 44 years |
| Immigrants | Brazil | 67.0 /100 | #153 | Good 4.6% |
| Immigrants | Western Europe | 65.5 /100 | #154 | Good 4.6% |
| Whites/Caucasians | 64.9 /100 | #155 | Good 4.6% |
| South Americans | 63.7 /100 | #156 | Good 4.6% |
| Immigrants | Belarus | 63.4 /100 | #157 | Good 4.6% |
| Immigrants | Iran | 63.1 /100 | #158 | Good 4.6% |
| Albanians | 63.0 /100 | #159 | Good 4.6% |
| Hungarians | 62.6 /100 | #160 | Good 4.6% |
| Celtics | 61.7 /100 | #161 | Good 4.7% |
| Costa Ricans | 59.6 /100 | #162 | Average 4.7% |
| South Africans | 58.5 /100 | #163 | Average 4.7% |
| Immigrants | Morocco | 57.2 /100 | #164 | Average 4.7% |
| German Russians | 57.2 /100 | #165 | Average 4.7% |
| French | 55.6 /100 | #166 | Average 4.7% |
| Peruvians | 54.4 /100 | #167 | Average 4.7% |