Spaniard vs Immigrants from Portugal Unemployment Among Ages 20 to 24 years
COMPARE
Spaniard
Immigrants from Portugal
Unemployment Among Ages 20 to 24 years
Unemployment Among Ages 20 to 24 years Comparison
Spaniards
Immigrants from Portugal
10.3%
UNEMPLOYMENT AMONG AGES 20 TO 24 YEARS
63.4/ 100
METRIC RATING
160th/ 347
METRIC RANK
10.4%
UNEMPLOYMENT AMONG AGES 20 TO 24 YEARS
25.3/ 100
METRIC RATING
193rd/ 347
METRIC RANK
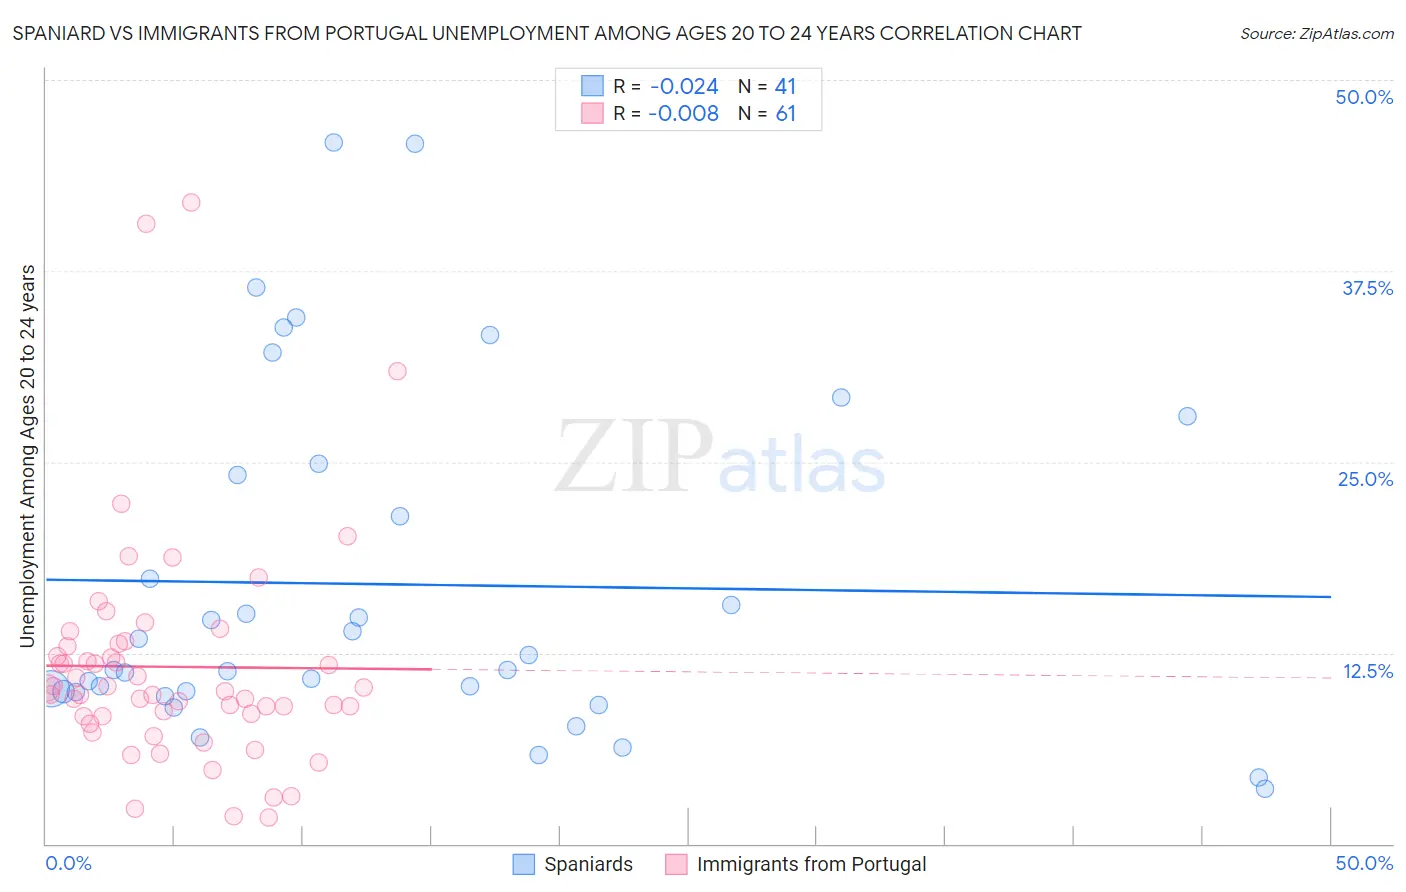
Spaniard vs Immigrants from Portugal Unemployment Among Ages 20 to 24 years Correlation Chart
The statistical analysis conducted on geographies consisting of 426,815,465 people shows no correlation between the proportion of Spaniards and unemployment rate among population between the ages 20 and 24 in the United States with a correlation coefficient (R) of -0.024 and weighted average of 10.3%. Similarly, the statistical analysis conducted on geographies consisting of 172,080,207 people shows no correlation between the proportion of Immigrants from Portugal and unemployment rate among population between the ages 20 and 24 in the United States with a correlation coefficient (R) of -0.008 and weighted average of 10.4%, a difference of 1.5%.
Unemployment Among Ages 20 to 24 years Correlation Summary
| Measurement | Spaniard | Immigrants from Portugal |
| Minimum | 3.6% | 1.7% |
| Maximum | 45.9% | 42.0% |
| Range | 42.3% | 40.3% |
| Mean | 17.0% | 11.6% |
| Median | 11.4% | 10.0% |
| Interquartile 25% (IQ1) | 9.9% | 8.3% |
| Interquartile 75% (IQ3) | 24.5% | 13.0% |
| Interquartile Range (IQR) | 14.6% | 4.7% |
| Standard Deviation (Sample) | 11.2% | 7.4% |
| Standard Deviation (Population) | 11.1% | 7.4% |
Similar Demographics by Unemployment Among Ages 20 to 24 years
Demographics Similar to Spaniards by Unemployment Among Ages 20 to 24 years
In terms of unemployment among ages 20 to 24 years, the demographic groups most similar to Spaniards are Immigrants from England (10.3%, a difference of 0.010%), Indian (Asian) (10.3%, a difference of 0.030%), Immigrants from Kazakhstan (10.2%, a difference of 0.080%), Immigrants from Asia (10.3%, a difference of 0.080%), and Immigrants from Uganda (10.2%, a difference of 0.090%).
| Demographics | Rating | Rank | Unemployment Among Ages 20 to 24 years |
| Immigrants | Taiwan | 71.4 /100 | #153 | Good 10.2% |
| Immigrants | Switzerland | 71.3 /100 | #154 | Good 10.2% |
| Lithuanians | 70.0 /100 | #155 | Good 10.2% |
| Canadians | 66.7 /100 | #156 | Good 10.2% |
| Immigrants | Uganda | 65.6 /100 | #157 | Good 10.2% |
| Immigrants | Kazakhstan | 65.5 /100 | #158 | Good 10.2% |
| Immigrants | England | 63.7 /100 | #159 | Good 10.3% |
| Spaniards | 63.4 /100 | #160 | Good 10.3% |
| Indians (Asian) | 62.6 /100 | #161 | Good 10.3% |
| Immigrants | Asia | 61.3 /100 | #162 | Good 10.3% |
| Estonians | 61.1 /100 | #163 | Good 10.3% |
| Immigrants | Korea | 59.0 /100 | #164 | Average 10.3% |
| Lebanese | 58.3 /100 | #165 | Average 10.3% |
| Italians | 57.7 /100 | #166 | Average 10.3% |
| Immigrants | Fiji | 57.6 /100 | #167 | Average 10.3% |
Demographics Similar to Immigrants from Portugal by Unemployment Among Ages 20 to 24 years
In terms of unemployment among ages 20 to 24 years, the demographic groups most similar to Immigrants from Portugal are Immigrants from Eastern Europe (10.4%, a difference of 0.020%), Ugandan (10.4%, a difference of 0.020%), Immigrants from Italy (10.4%, a difference of 0.020%), Egyptian (10.4%, a difference of 0.040%), and Immigrants from Philippines (10.4%, a difference of 0.060%).
| Demographics | Rating | Rank | Unemployment Among Ages 20 to 24 years |
| Guamanians/Chamorros | 35.4 /100 | #186 | Fair 10.4% |
| Immigrants | Western Europe | 35.0 /100 | #187 | Fair 10.4% |
| Immigrants | Russia | 34.6 /100 | #188 | Fair 10.4% |
| Hawaiians | 33.9 /100 | #189 | Fair 10.4% |
| Immigrants | China | 32.6 /100 | #190 | Fair 10.4% |
| Immigrants | Eastern Europe | 25.8 /100 | #191 | Fair 10.4% |
| Ugandans | 25.7 /100 | #192 | Fair 10.4% |
| Immigrants | Portugal | 25.3 /100 | #193 | Fair 10.4% |
| Immigrants | Italy | 25.0 /100 | #194 | Fair 10.4% |
| Egyptians | 24.5 /100 | #195 | Fair 10.4% |
| Immigrants | Philippines | 24.1 /100 | #196 | Fair 10.4% |
| Immigrants | Denmark | 22.8 /100 | #197 | Fair 10.4% |
| Colombians | 22.3 /100 | #198 | Fair 10.4% |
| Portuguese | 21.8 /100 | #199 | Fair 10.4% |
| Russians | 21.2 /100 | #200 | Fair 10.4% |