Soviet Union vs Puget Sound Salish Unemployment Among Ages 35 to 44 years
COMPARE
Soviet Union
Puget Sound Salish
Unemployment Among Ages 35 to 44 years
Unemployment Among Ages 35 to 44 years Comparison
Soviet Union
Puget Sound Salish
4.8%
UNEMPLOYMENT AMONG AGES 35 TO 44 YEARS
18.4/ 100
METRIC RATING
206th/ 347
METRIC RANK
4.6%
UNEMPLOYMENT AMONG AGES 35 TO 44 YEARS
67.1/ 100
METRIC RATING
151st/ 347
METRIC RANK
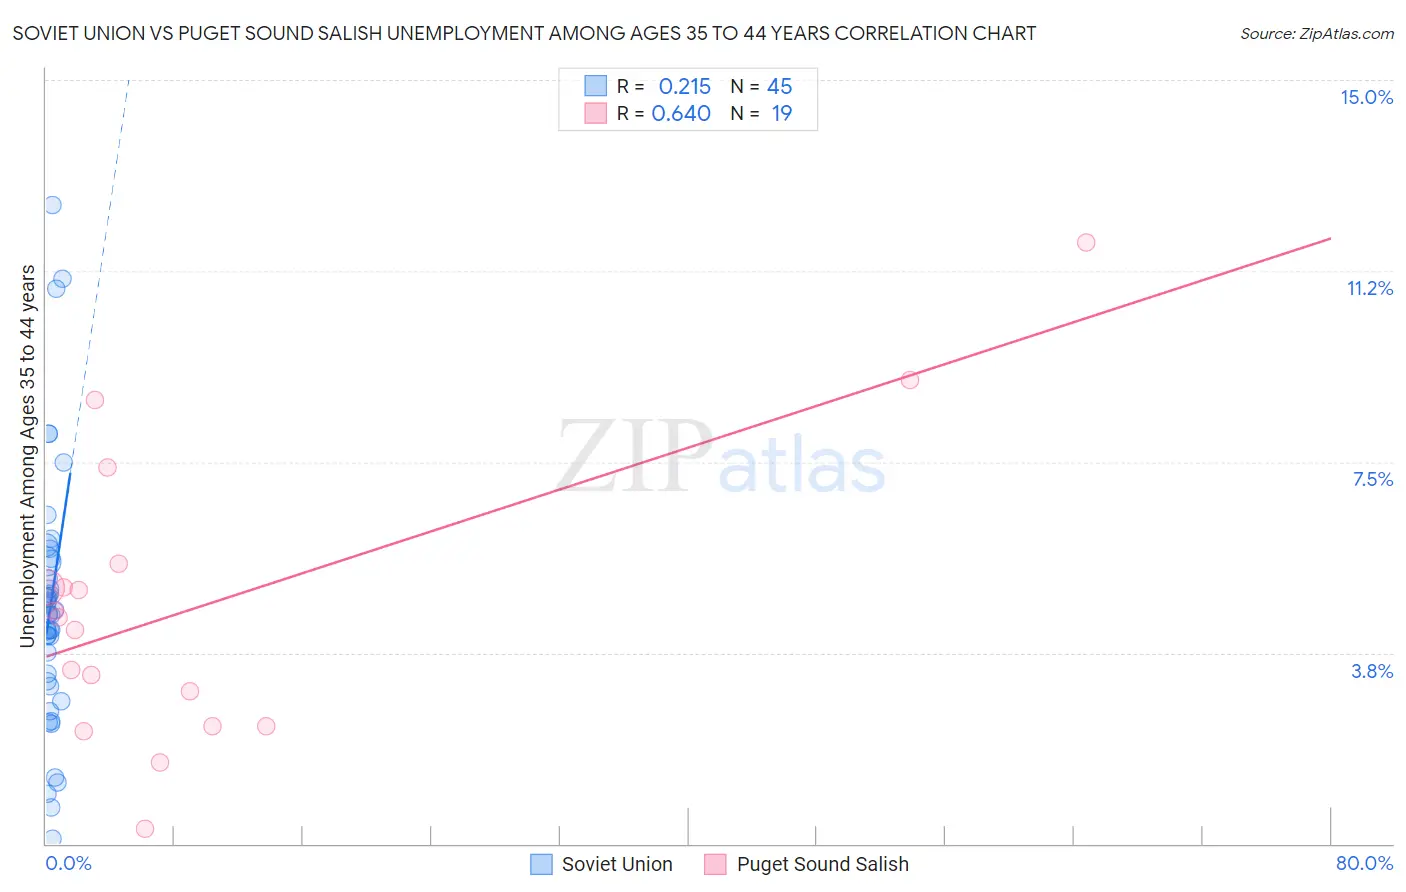
Soviet Union vs Puget Sound Salish Unemployment Among Ages 35 to 44 years Correlation Chart
The statistical analysis conducted on geographies consisting of 43,408,210 people shows a weak positive correlation between the proportion of Soviet Union and unemployment rate among population between the ages 35 and 44 in the United States with a correlation coefficient (R) of 0.215 and weighted average of 4.8%. Similarly, the statistical analysis conducted on geographies consisting of 45,742,187 people shows a significant positive correlation between the proportion of Puget Sound Salish and unemployment rate among population between the ages 35 and 44 in the United States with a correlation coefficient (R) of 0.640 and weighted average of 4.6%, a difference of 4.0%.
Unemployment Among Ages 35 to 44 years Correlation Summary
| Measurement | Soviet Union | Puget Sound Salish |
| Minimum | 0.10% | 0.30% |
| Maximum | 12.5% | 11.8% |
| Range | 12.4% | 11.5% |
| Mean | 4.7% | 4.7% |
| Median | 4.5% | 4.4% |
| Interquartile 25% (IQ1) | 3.1% | 2.3% |
| Interquartile 75% (IQ3) | 5.6% | 5.5% |
| Interquartile Range (IQR) | 2.4% | 3.2% |
| Standard Deviation (Sample) | 2.6% | 2.9% |
| Standard Deviation (Population) | 2.5% | 2.8% |
Similar Demographics by Unemployment Among Ages 35 to 44 years
Demographics Similar to Soviet Union by Unemployment Among Ages 35 to 44 years
In terms of unemployment among ages 35 to 44 years, the demographic groups most similar to Soviet Union are Spaniard (4.8%, a difference of 0.040%), Immigrants from Philippines (4.8%, a difference of 0.16%), Uruguayan (4.8%, a difference of 0.18%), Immigrants from Afghanistan (4.8%, a difference of 0.21%), and Immigrants from Western Asia (4.8%, a difference of 0.21%).
| Demographics | Rating | Rank | Unemployment Among Ages 35 to 44 years |
| Immigrants | Middle Africa | 21.9 /100 | #199 | Fair 4.8% |
| Immigrants | Ukraine | 21.4 /100 | #200 | Fair 4.8% |
| Ugandans | 21.4 /100 | #201 | Fair 4.8% |
| Immigrants | Afghanistan | 20.2 /100 | #202 | Fair 4.8% |
| Uruguayans | 20.0 /100 | #203 | Fair 4.8% |
| Immigrants | Philippines | 19.8 /100 | #204 | Poor 4.8% |
| Spaniards | 18.7 /100 | #205 | Poor 4.8% |
| Soviet Union | 18.4 /100 | #206 | Poor 4.8% |
| Immigrants | Western Asia | 16.6 /100 | #207 | Poor 4.8% |
| French Canadians | 16.5 /100 | #208 | Poor 4.8% |
| Immigrants | Uruguay | 11.5 /100 | #209 | Poor 4.9% |
| Immigrants | Cameroon | 11.4 /100 | #210 | Poor 4.9% |
| Immigrants | Nonimmigrants | 9.4 /100 | #211 | Tragic 4.9% |
| Fijians | 8.7 /100 | #212 | Tragic 4.9% |
| Osage | 8.6 /100 | #213 | Tragic 4.9% |
Demographics Similar to Puget Sound Salish by Unemployment Among Ages 35 to 44 years
In terms of unemployment among ages 35 to 44 years, the demographic groups most similar to Puget Sound Salish are Pakistani (4.6%, a difference of 0.0%), Immigrants from Brazil (4.6%, a difference of 0.010%), Immigrants from Western Europe (4.6%, a difference of 0.13%), White/Caucasian (4.6%, a difference of 0.18%), and South American (4.6%, a difference of 0.27%).
| Demographics | Rating | Rank | Unemployment Among Ages 35 to 44 years |
| Immigrants | Russia | 75.4 /100 | #144 | Good 4.6% |
| Immigrants | Eastern Europe | 74.7 /100 | #145 | Good 4.6% |
| Immigrants | Denmark | 74.4 /100 | #146 | Good 4.6% |
| Immigrants | Vietnam | 73.8 /100 | #147 | Good 4.6% |
| Slavs | 72.4 /100 | #148 | Good 4.6% |
| Immigrants | Burma/Myanmar | 72.2 /100 | #149 | Good 4.6% |
| Immigrants | England | 70.5 /100 | #150 | Good 4.6% |
| Puget Sound Salish | 67.1 /100 | #151 | Good 4.6% |
| Pakistanis | 67.1 /100 | #152 | Good 4.6% |
| Immigrants | Brazil | 67.0 /100 | #153 | Good 4.6% |
| Immigrants | Western Europe | 65.5 /100 | #154 | Good 4.6% |
| Whites/Caucasians | 64.9 /100 | #155 | Good 4.6% |
| South Americans | 63.7 /100 | #156 | Good 4.6% |
| Immigrants | Belarus | 63.4 /100 | #157 | Good 4.6% |
| Immigrants | Iran | 63.1 /100 | #158 | Good 4.6% |