Soviet Union vs Apache Unemployment Among Ages 16 to 19 years
COMPARE
Soviet Union
Apache
Unemployment Among Ages 16 to 19 years
Unemployment Among Ages 16 to 19 years Comparison
Soviet Union
Apache
16.8%
UNEMPLOYMENT AMONG AGES 16 TO 19 YEARS
97.8/ 100
METRIC RATING
78th/ 347
METRIC RANK
18.8%
UNEMPLOYMENT AMONG AGES 16 TO 19 YEARS
0.3/ 100
METRIC RATING
254th/ 347
METRIC RANK
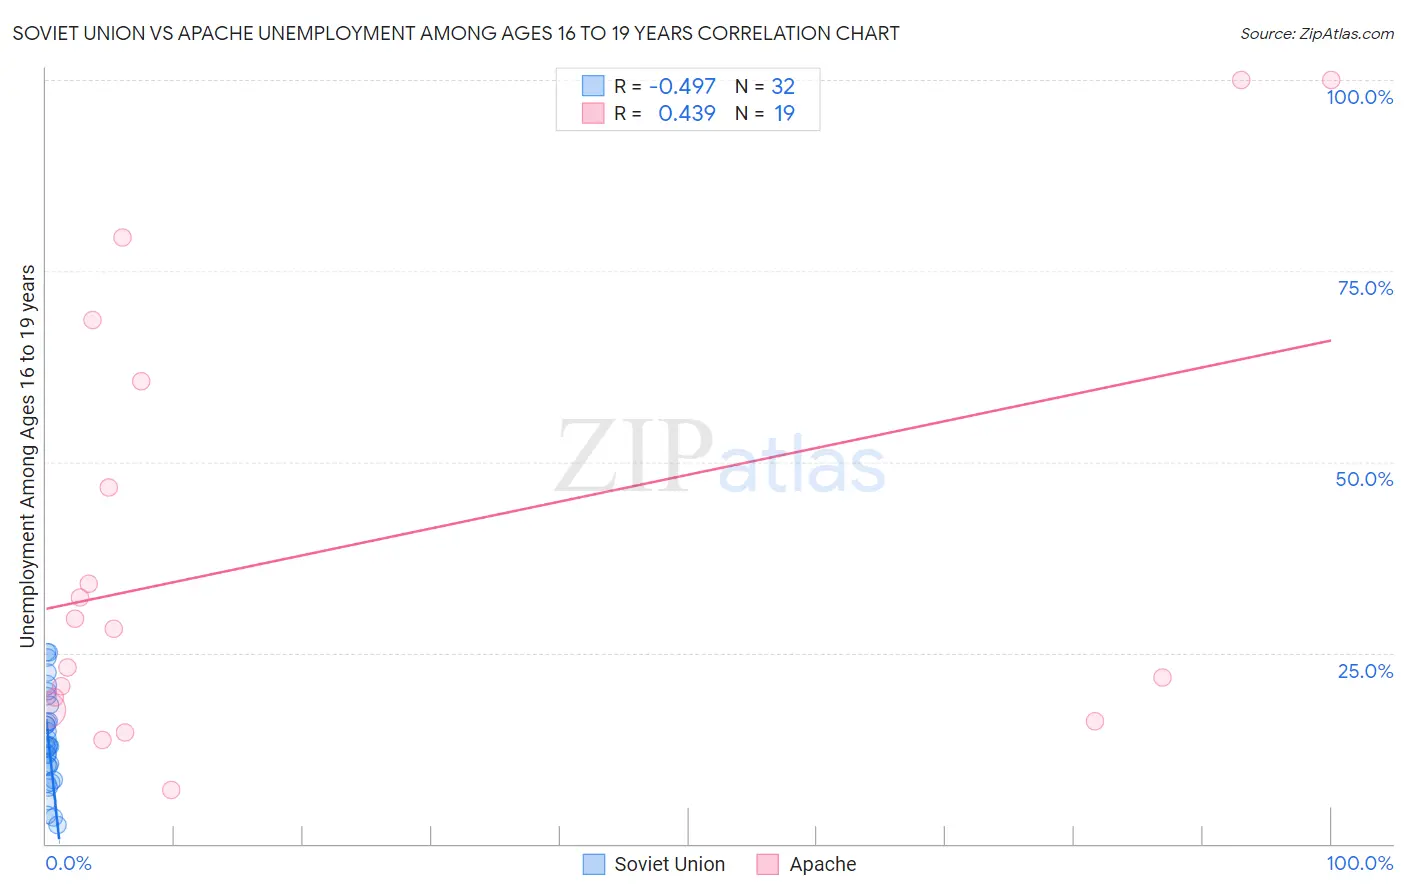
Soviet Union vs Apache Unemployment Among Ages 16 to 19 years Correlation Chart
The statistical analysis conducted on geographies consisting of 43,026,964 people shows a moderate negative correlation between the proportion of Soviet Union and unemployment rate among population between the ages 16 and 19 in the United States with a correlation coefficient (R) of -0.497 and weighted average of 16.8%. Similarly, the statistical analysis conducted on geographies consisting of 223,374,424 people shows a moderate positive correlation between the proportion of Apache and unemployment rate among population between the ages 16 and 19 in the United States with a correlation coefficient (R) of 0.439 and weighted average of 18.8%, a difference of 12.0%.
Unemployment Among Ages 16 to 19 years Correlation Summary
| Measurement | Soviet Union | Apache |
| Minimum | 2.5% | 7.1% |
| Maximum | 25.1% | 100.0% |
| Range | 22.6% | 92.9% |
| Mean | 13.5% | 38.5% |
| Median | 12.9% | 28.1% |
| Interquartile 25% (IQ1) | 9.2% | 17.5% |
| Interquartile 75% (IQ3) | 17.1% | 60.6% |
| Interquartile Range (IQR) | 7.9% | 43.2% |
| Standard Deviation (Sample) | 6.2% | 29.1% |
| Standard Deviation (Population) | 6.1% | 28.4% |
Similar Demographics by Unemployment Among Ages 16 to 19 years
Demographics Similar to Soviet Union by Unemployment Among Ages 16 to 19 years
In terms of unemployment among ages 16 to 19 years, the demographic groups most similar to Soviet Union are Immigrants from Singapore (16.8%, a difference of 0.020%), Immigrants from North America (16.8%, a difference of 0.090%), New Zealander (16.8%, a difference of 0.15%), Slovak (16.8%, a difference of 0.15%), and French Canadian (16.8%, a difference of 0.15%).
| Demographics | Rating | Rank | Unemployment Among Ages 16 to 19 years |
| Latvians | 98.5 /100 | #71 | Exceptional 16.7% |
| Immigrants | Canada | 98.5 /100 | #72 | Exceptional 16.7% |
| Lithuanians | 98.2 /100 | #73 | Exceptional 16.7% |
| Immigrants | Eastern Africa | 98.1 /100 | #74 | Exceptional 16.8% |
| New Zealanders | 98.0 /100 | #75 | Exceptional 16.8% |
| Immigrants | North America | 97.9 /100 | #76 | Exceptional 16.8% |
| Immigrants | Singapore | 97.8 /100 | #77 | Exceptional 16.8% |
| Soviet Union | 97.8 /100 | #78 | Exceptional 16.8% |
| Slovaks | 97.5 /100 | #79 | Exceptional 16.8% |
| French Canadians | 97.5 /100 | #80 | Exceptional 16.8% |
| Immigrants | Latvia | 97.5 /100 | #81 | Exceptional 16.8% |
| Whites/Caucasians | 97.5 /100 | #82 | Exceptional 16.8% |
| Ugandans | 97.4 /100 | #83 | Exceptional 16.8% |
| French | 97.4 /100 | #84 | Exceptional 16.8% |
| Immigrants | Kuwait | 97.2 /100 | #85 | Exceptional 16.8% |
Demographics Similar to Apache by Unemployment Among Ages 16 to 19 years
In terms of unemployment among ages 16 to 19 years, the demographic groups most similar to Apache are Immigrants from Cameroon (18.8%, a difference of 0.010%), Central American (18.8%, a difference of 0.030%), Mexican American Indian (18.8%, a difference of 0.080%), Immigrants from Guatemala (18.7%, a difference of 0.34%), and Immigrants from Nigeria (18.9%, a difference of 0.34%).
| Demographics | Rating | Rank | Unemployment Among Ages 16 to 19 years |
| Immigrants | Israel | 0.5 /100 | #247 | Tragic 18.7% |
| Delaware | 0.5 /100 | #248 | Tragic 18.7% |
| Puget Sound Salish | 0.5 /100 | #249 | Tragic 18.7% |
| Panamanians | 0.4 /100 | #250 | Tragic 18.7% |
| Sub-Saharan Africans | 0.4 /100 | #251 | Tragic 18.7% |
| Immigrants | Guatemala | 0.4 /100 | #252 | Tragic 18.7% |
| Central Americans | 0.3 /100 | #253 | Tragic 18.8% |
| Apache | 0.3 /100 | #254 | Tragic 18.8% |
| Immigrants | Cameroon | 0.3 /100 | #255 | Tragic 18.8% |
| Mexican American Indians | 0.3 /100 | #256 | Tragic 18.8% |
| Immigrants | Nigeria | 0.2 /100 | #257 | Tragic 18.9% |
| Immigrants | Mexico | 0.2 /100 | #258 | Tragic 18.9% |
| Immigrants | Central America | 0.2 /100 | #259 | Tragic 18.9% |
| Nigerians | 0.2 /100 | #260 | Tragic 18.9% |
| Spanish American Indians | 0.1 /100 | #261 | Tragic 18.9% |