South American vs Turkish Unemployment Among Women with Children Under 18 years
COMPARE
South American
Turkish
Unemployment Among Women with Children Under 18 years
Unemployment Among Women with Children Under 18 years Comparison
South Americans
Turks
5.7%
UNEMPLOYMENT AMONG WOMEN WITH CHILDREN UNDER 18 YEARS
10.0/ 100
METRIC RATING
212th/ 347
METRIC RANK
5.0%
UNEMPLOYMENT AMONG WOMEN WITH CHILDREN UNDER 18 YEARS
98.9/ 100
METRIC RATING
43rd/ 347
METRIC RANK
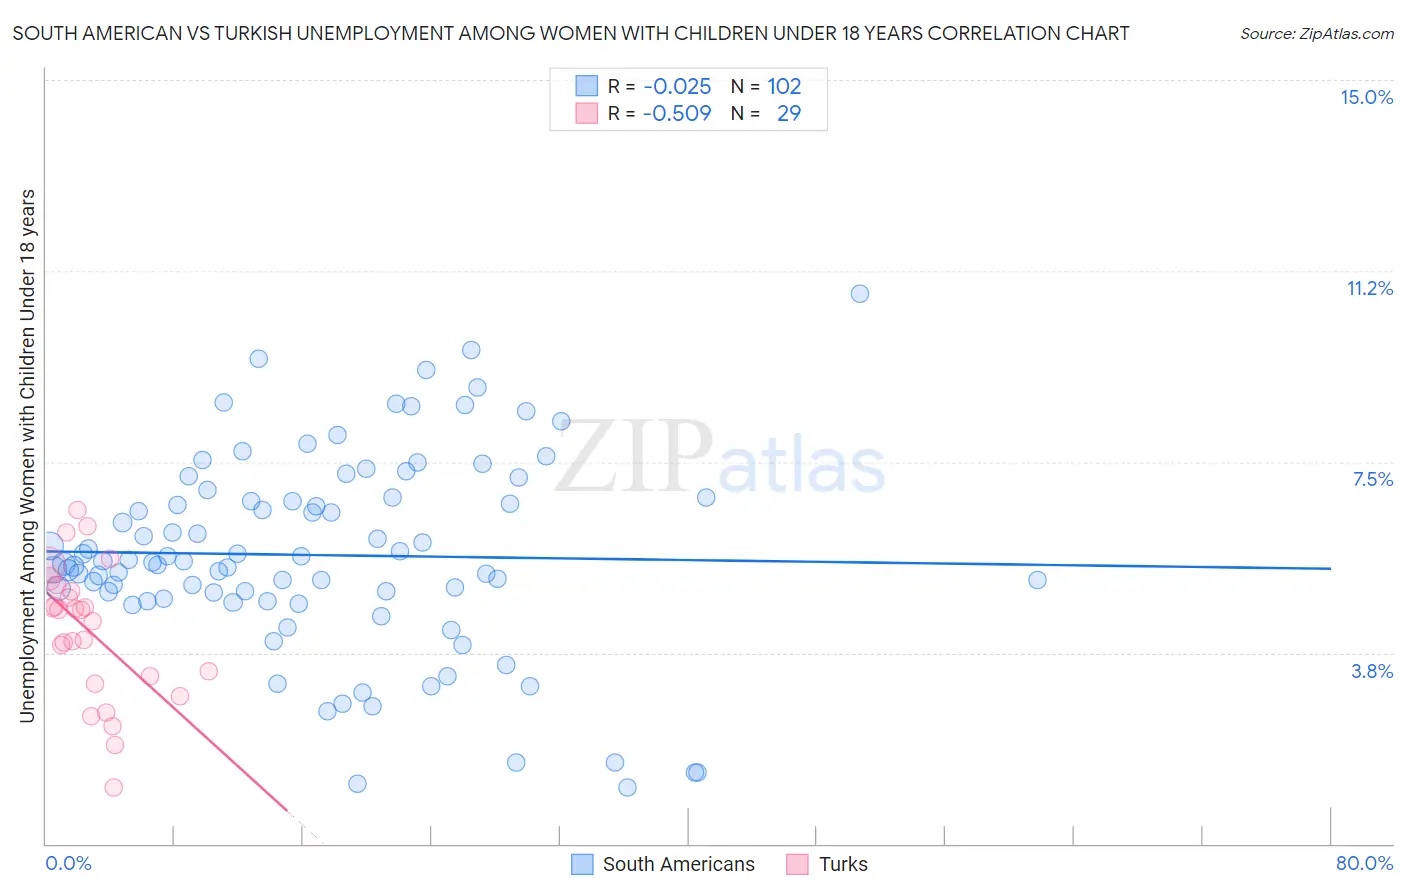
South American vs Turkish Unemployment Among Women with Children Under 18 years Correlation Chart
The statistical analysis conducted on geographies consisting of 466,888,990 people shows no correlation between the proportion of South Americans and unemployment rate among women with children under the age of 18 in the United States with a correlation coefficient (R) of -0.025 and weighted average of 5.7%. Similarly, the statistical analysis conducted on geographies consisting of 264,750,560 people shows a substantial negative correlation between the proportion of Turks and unemployment rate among women with children under the age of 18 in the United States with a correlation coefficient (R) of -0.509 and weighted average of 5.0%, a difference of 12.9%.
Unemployment Among Women with Children Under 18 years Correlation Summary
| Measurement | South American | Turkish |
| Minimum | 1.1% | 1.1% |
| Maximum | 10.8% | 6.6% |
| Range | 9.7% | 5.5% |
| Mean | 5.7% | 4.2% |
| Median | 5.5% | 4.6% |
| Interquartile 25% (IQ1) | 4.8% | 3.2% |
| Interquartile 75% (IQ3) | 6.8% | 5.0% |
| Interquartile Range (IQR) | 2.0% | 1.8% |
| Standard Deviation (Sample) | 1.9% | 1.3% |
| Standard Deviation (Population) | 1.9% | 1.3% |
Similar Demographics by Unemployment Among Women with Children Under 18 years
Demographics Similar to South Americans by Unemployment Among Women with Children Under 18 years
In terms of unemployment among women with children under 18 years, the demographic groups most similar to South Americans are Panamanian (5.7%, a difference of 0.010%), Nonimmigrants (5.7%, a difference of 0.12%), American (5.7%, a difference of 0.22%), Immigrants from Western Asia (5.6%, a difference of 0.23%), and Japanese (5.7%, a difference of 0.25%).
| Demographics | Rating | Rank | Unemployment Among Women with Children Under 18 years |
| Tsimshian | 15.2 /100 | #205 | Poor 5.6% |
| Nicaraguans | 12.3 /100 | #206 | Poor 5.6% |
| Peruvians | 12.1 /100 | #207 | Poor 5.6% |
| Immigrants | Costa Rica | 11.6 /100 | #208 | Poor 5.6% |
| Immigrants | Western Asia | 11.3 /100 | #209 | Poor 5.6% |
| Immigrants | Nonimmigrants | 10.6 /100 | #210 | Poor 5.7% |
| Panamanians | 10.1 /100 | #211 | Poor 5.7% |
| South Americans | 10.0 /100 | #212 | Poor 5.7% |
| Americans | 8.9 /100 | #213 | Tragic 5.7% |
| Japanese | 8.7 /100 | #214 | Tragic 5.7% |
| Immigrants | Uganda | 7.9 /100 | #215 | Tragic 5.7% |
| Immigrants | Peru | 7.4 /100 | #216 | Tragic 5.7% |
| Immigrants | Brazil | 7.1 /100 | #217 | Tragic 5.7% |
| Immigrants | Nicaragua | 7.0 /100 | #218 | Tragic 5.7% |
| Iroquois | 6.5 /100 | #219 | Tragic 5.7% |
Demographics Similar to Turks by Unemployment Among Women with Children Under 18 years
In terms of unemployment among women with children under 18 years, the demographic groups most similar to Turks are Eastern European (5.0%, a difference of 0.050%), Immigrants from Moldova (5.0%, a difference of 0.060%), Immigrants from Bosnia and Herzegovina (5.0%, a difference of 0.13%), Immigrants from Malaysia (5.0%, a difference of 0.14%), and Greek (5.0%, a difference of 0.19%).
| Demographics | Rating | Rank | Unemployment Among Women with Children Under 18 years |
| Mongolians | 99.2 /100 | #36 | Exceptional 5.0% |
| Poles | 99.2 /100 | #37 | Exceptional 5.0% |
| Bhutanese | 99.2 /100 | #38 | Exceptional 5.0% |
| English | 99.1 /100 | #39 | Exceptional 5.0% |
| Greeks | 99.0 /100 | #40 | Exceptional 5.0% |
| Immigrants | Bosnia and Herzegovina | 99.0 /100 | #41 | Exceptional 5.0% |
| Eastern Europeans | 98.9 /100 | #42 | Exceptional 5.0% |
| Turks | 98.9 /100 | #43 | Exceptional 5.0% |
| Immigrants | Moldova | 98.9 /100 | #44 | Exceptional 5.0% |
| Immigrants | Malaysia | 98.8 /100 | #45 | Exceptional 5.0% |
| Immigrants | Korea | 98.7 /100 | #46 | Exceptional 5.0% |
| British | 98.7 /100 | #47 | Exceptional 5.0% |
| Northern Europeans | 98.6 /100 | #48 | Exceptional 5.0% |
| Lithuanians | 98.4 /100 | #49 | Exceptional 5.0% |
| Immigrants | Japan | 98.4 /100 | #50 | Exceptional 5.0% |