South American vs Immigrants from Sri Lanka Unemployment Among Ages 45 to 54 years
COMPARE
South American
Immigrants from Sri Lanka
Unemployment Among Ages 45 to 54 years
Unemployment Among Ages 45 to 54 years Comparison
South Americans
Immigrants from Sri Lanka
4.6%
UNEMPLOYMENT AMONG AGES 45 TO 54 YEARS
32.9/ 100
METRIC RATING
194th/ 347
METRIC RANK
4.3%
UNEMPLOYMENT AMONG AGES 45 TO 54 YEARS
99.3/ 100
METRIC RATING
57th/ 347
METRIC RANK
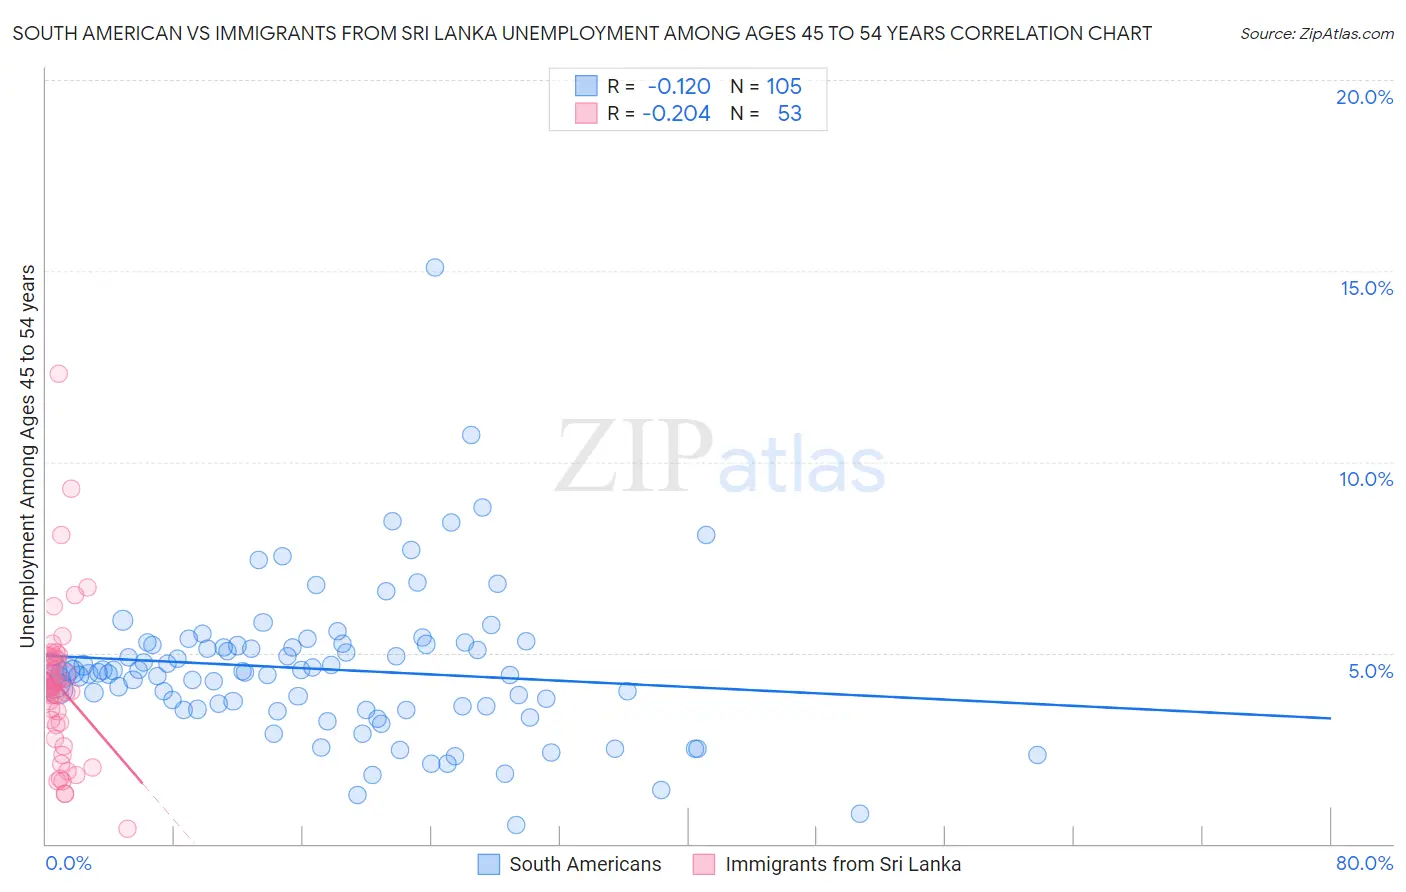
South American vs Immigrants from Sri Lanka Unemployment Among Ages 45 to 54 years Correlation Chart
The statistical analysis conducted on geographies consisting of 475,154,525 people shows a poor negative correlation between the proportion of South Americans and unemployment rate among population between the ages 45 and 54 in the United States with a correlation coefficient (R) of -0.120 and weighted average of 4.6%. Similarly, the statistical analysis conducted on geographies consisting of 148,602,892 people shows a weak negative correlation between the proportion of Immigrants from Sri Lanka and unemployment rate among population between the ages 45 and 54 in the United States with a correlation coefficient (R) of -0.204 and weighted average of 4.3%, a difference of 7.0%.
Unemployment Among Ages 45 to 54 years Correlation Summary
| Measurement | South American | Immigrants from Sri Lanka |
| Minimum | 0.50% | 0.40% |
| Maximum | 15.1% | 12.3% |
| Range | 14.6% | 11.9% |
| Mean | 4.6% | 4.1% |
| Median | 4.5% | 4.1% |
| Interquartile 25% (IQ1) | 3.5% | 2.9% |
| Interquartile 75% (IQ3) | 5.2% | 4.8% |
| Interquartile Range (IQR) | 1.7% | 1.9% |
| Standard Deviation (Sample) | 2.0% | 2.0% |
| Standard Deviation (Population) | 2.0% | 2.0% |
Similar Demographics by Unemployment Among Ages 45 to 54 years
Demographics Similar to South Americans by Unemployment Among Ages 45 to 54 years
In terms of unemployment among ages 45 to 54 years, the demographic groups most similar to South Americans are Immigrants from Lithuania (4.6%, a difference of 0.020%), Immigrants from Thailand (4.6%, a difference of 0.060%), Peruvian (4.6%, a difference of 0.070%), Immigrants from Uruguay (4.6%, a difference of 0.080%), and Estonian (4.6%, a difference of 0.090%).
| Demographics | Rating | Rank | Unemployment Among Ages 45 to 54 years |
| Immigrants | Ukraine | 36.8 /100 | #187 | Fair 4.5% |
| Immigrants | Sierra Leone | 36.3 /100 | #188 | Fair 4.6% |
| Immigrants | Laos | 35.7 /100 | #189 | Fair 4.6% |
| Immigrants | Serbia | 34.8 /100 | #190 | Fair 4.6% |
| Immigrants | Uruguay | 34.4 /100 | #191 | Fair 4.6% |
| Immigrants | Thailand | 34.1 /100 | #192 | Fair 4.6% |
| Immigrants | Lithuania | 33.2 /100 | #193 | Fair 4.6% |
| South Americans | 32.9 /100 | #194 | Fair 4.6% |
| Peruvians | 31.5 /100 | #195 | Fair 4.6% |
| Estonians | 31.2 /100 | #196 | Fair 4.6% |
| Albanians | 31.1 /100 | #197 | Fair 4.6% |
| Immigrants | Belarus | 30.6 /100 | #198 | Fair 4.6% |
| Brazilians | 20.1 /100 | #199 | Fair 4.6% |
| Immigrants | Denmark | 19.8 /100 | #200 | Poor 4.6% |
| Immigrants | Costa Rica | 19.7 /100 | #201 | Poor 4.6% |
Demographics Similar to Immigrants from Sri Lanka by Unemployment Among Ages 45 to 54 years
In terms of unemployment among ages 45 to 54 years, the demographic groups most similar to Immigrants from Sri Lanka are Greek (4.3%, a difference of 0.050%), Immigrants from Jordan (4.3%, a difference of 0.060%), Okinawan (4.3%, a difference of 0.13%), Immigrants from Korea (4.3%, a difference of 0.16%), and Immigrants from Pakistan (4.3%, a difference of 0.16%).
| Demographics | Rating | Rank | Unemployment Among Ages 45 to 54 years |
| Basques | 99.6 /100 | #50 | Exceptional 4.2% |
| Burmese | 99.6 /100 | #51 | Exceptional 4.2% |
| Poles | 99.5 /100 | #52 | Exceptional 4.2% |
| Irish | 99.5 /100 | #53 | Exceptional 4.2% |
| Chickasaw | 99.5 /100 | #54 | Exceptional 4.2% |
| Latvians | 99.4 /100 | #55 | Exceptional 4.2% |
| Immigrants | Jordan | 99.3 /100 | #56 | Exceptional 4.3% |
| Immigrants | Sri Lanka | 99.3 /100 | #57 | Exceptional 4.3% |
| Greeks | 99.3 /100 | #58 | Exceptional 4.3% |
| Okinawans | 99.2 /100 | #59 | Exceptional 4.3% |
| Immigrants | Korea | 99.2 /100 | #60 | Exceptional 4.3% |
| Immigrants | Pakistan | 99.2 /100 | #61 | Exceptional 4.3% |
| Lithuanians | 99.1 /100 | #62 | Exceptional 4.3% |
| Pennsylvania Germans | 99.1 /100 | #63 | Exceptional 4.3% |
| Austrians | 99.0 /100 | #64 | Exceptional 4.3% |