South American Indian vs Immigrants from Iraq Unemployment Among Ages 55 to 59 years
COMPARE
South American Indian
Immigrants from Iraq
Unemployment Among Ages 55 to 59 years
Unemployment Among Ages 55 to 59 years Comparison
South American Indians
Immigrants from Iraq
4.7%
UNEMPLOYMENT AMONG AGES 55 TO 59 YEARS
90.9/ 100
METRIC RATING
115th/ 347
METRIC RANK
4.6%
UNEMPLOYMENT AMONG AGES 55 TO 59 YEARS
98.5/ 100
METRIC RATING
75th/ 347
METRIC RANK
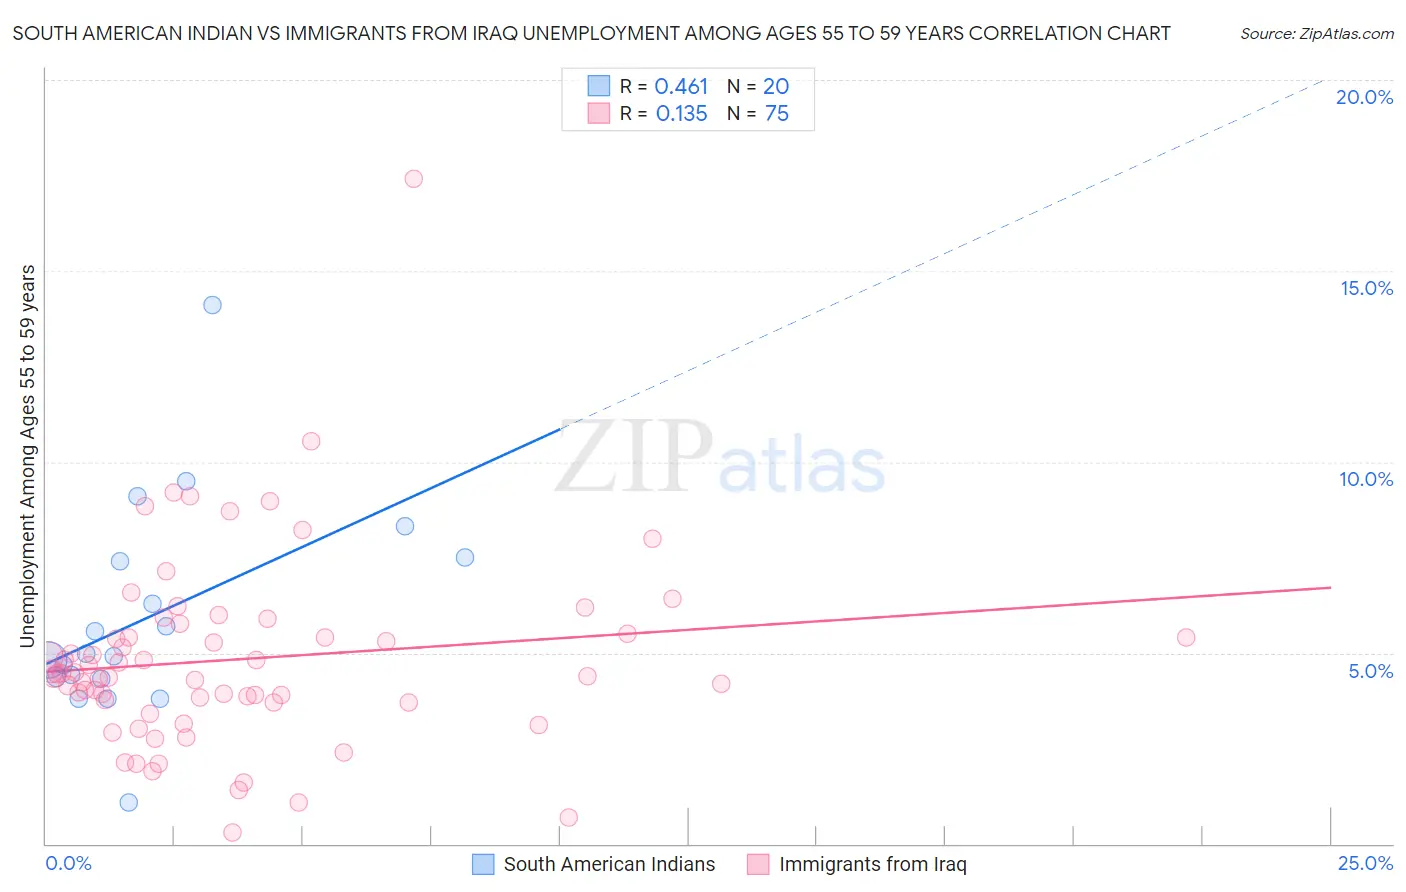
South American Indian vs Immigrants from Iraq Unemployment Among Ages 55 to 59 years Correlation Chart
The statistical analysis conducted on geographies consisting of 160,494,034 people shows a moderate positive correlation between the proportion of South American Indians and unemployment rate among population between the ages 55 and 59 in the United States with a correlation coefficient (R) of 0.461 and weighted average of 4.7%. Similarly, the statistical analysis conducted on geographies consisting of 189,094,455 people shows a poor positive correlation between the proportion of Immigrants from Iraq and unemployment rate among population between the ages 55 and 59 in the United States with a correlation coefficient (R) of 0.135 and weighted average of 4.6%, a difference of 2.0%.
Unemployment Among Ages 55 to 59 years Correlation Summary
| Measurement | South American Indian | Immigrants from Iraq |
| Minimum | 1.1% | 0.30% |
| Maximum | 14.1% | 17.4% |
| Range | 13.0% | 17.1% |
| Mean | 5.9% | 4.8% |
| Median | 4.9% | 4.4% |
| Interquartile 25% (IQ1) | 4.3% | 3.7% |
| Interquartile 75% (IQ3) | 7.4% | 5.5% |
| Interquartile Range (IQR) | 3.1% | 1.8% |
| Standard Deviation (Sample) | 2.8% | 2.5% |
| Standard Deviation (Population) | 2.7% | 2.5% |
Similar Demographics by Unemployment Among Ages 55 to 59 years
Demographics Similar to South American Indians by Unemployment Among Ages 55 to 59 years
In terms of unemployment among ages 55 to 59 years, the demographic groups most similar to South American Indians are Turkish (4.7%, a difference of 0.0%), Asian (4.7%, a difference of 0.010%), Immigrants from Chile (4.7%, a difference of 0.030%), White/Caucasian (4.7%, a difference of 0.030%), and Bangladeshi (4.7%, a difference of 0.060%).
| Demographics | Rating | Rank | Unemployment Among Ages 55 to 59 years |
| French | 93.3 /100 | #108 | Exceptional 4.7% |
| Chileans | 93.2 /100 | #109 | Exceptional 4.7% |
| Egyptians | 92.9 /100 | #110 | Exceptional 4.7% |
| Austrians | 92.4 /100 | #111 | Exceptional 4.7% |
| Afghans | 92.1 /100 | #112 | Exceptional 4.7% |
| Immigrants | Spain | 91.4 /100 | #113 | Exceptional 4.7% |
| Bangladeshis | 91.3 /100 | #114 | Exceptional 4.7% |
| South American Indians | 90.9 /100 | #115 | Exceptional 4.7% |
| Turks | 90.9 /100 | #116 | Exceptional 4.7% |
| Asians | 90.8 /100 | #117 | Exceptional 4.7% |
| Immigrants | Chile | 90.7 /100 | #118 | Exceptional 4.7% |
| Whites/Caucasians | 90.7 /100 | #119 | Exceptional 4.7% |
| Immigrants | South Africa | 89.9 /100 | #120 | Excellent 4.7% |
| Pakistanis | 89.7 /100 | #121 | Excellent 4.7% |
| Immigrants | Afghanistan | 89.5 /100 | #122 | Excellent 4.7% |
Demographics Similar to Immigrants from Iraq by Unemployment Among Ages 55 to 59 years
In terms of unemployment among ages 55 to 59 years, the demographic groups most similar to Immigrants from Iraq are Croatian (4.6%, a difference of 0.020%), Immigrants from Bosnia and Herzegovina (4.6%, a difference of 0.070%), Scotch-Irish (4.6%, a difference of 0.080%), Bhutanese (4.6%, a difference of 0.090%), and Finnish (4.6%, a difference of 0.13%).
| Demographics | Rating | Rank | Unemployment Among Ages 55 to 59 years |
| Immigrants | Micronesia | 99.0 /100 | #68 | Exceptional 4.6% |
| Czechoslovakians | 99.0 /100 | #69 | Exceptional 4.6% |
| Filipinos | 98.8 /100 | #70 | Exceptional 4.6% |
| Immigrants | Jordan | 98.7 /100 | #71 | Exceptional 4.6% |
| Immigrants | Taiwan | 98.7 /100 | #72 | Exceptional 4.6% |
| Bhutanese | 98.6 /100 | #73 | Exceptional 4.6% |
| Croatians | 98.5 /100 | #74 | Exceptional 4.6% |
| Immigrants | Iraq | 98.5 /100 | #75 | Exceptional 4.6% |
| Immigrants | Bosnia and Herzegovina | 98.3 /100 | #76 | Exceptional 4.6% |
| Scotch-Irish | 98.3 /100 | #77 | Exceptional 4.6% |
| Finns | 98.2 /100 | #78 | Exceptional 4.6% |
| Sri Lankans | 98.1 /100 | #79 | Exceptional 4.6% |
| Cambodians | 98.0 /100 | #80 | Exceptional 4.6% |
| Taiwanese | 97.9 /100 | #81 | Exceptional 4.6% |
| Latvians | 97.8 /100 | #82 | Exceptional 4.6% |