South American Indian vs American Unemployment Among Ages 20 to 24 years
COMPARE
South American Indian
American
Unemployment Among Ages 20 to 24 years
Unemployment Among Ages 20 to 24 years Comparison
South American Indians
Americans
10.8%
UNEMPLOYMENT AMONG AGES 20 TO 24 YEARS
0.5/ 100
METRIC RATING
249th/ 347
METRIC RANK
10.6%
UNEMPLOYMENT AMONG AGES 20 TO 24 YEARS
4.4/ 100
METRIC RATING
229th/ 347
METRIC RANK
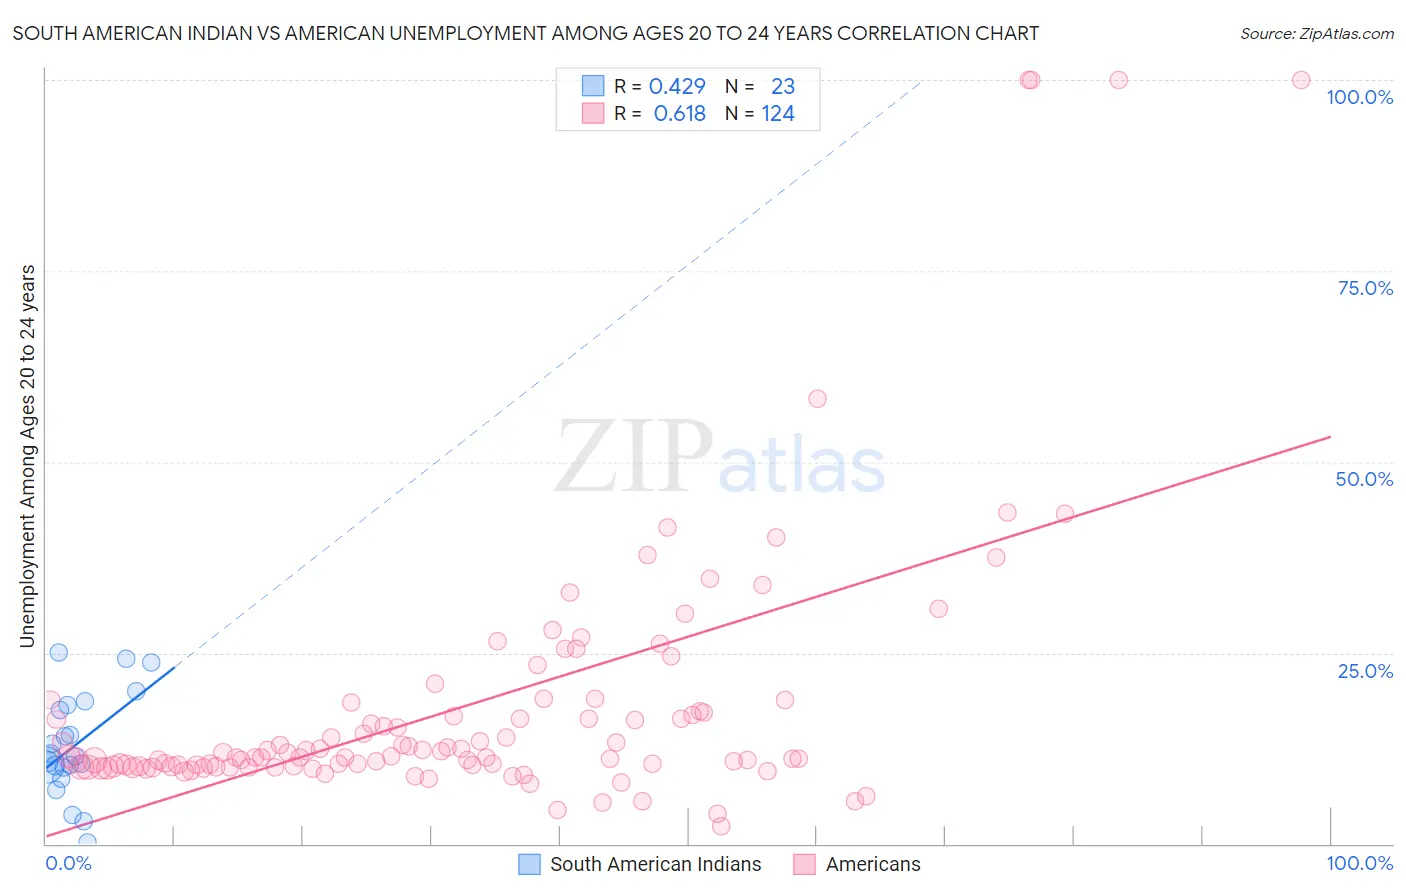
South American Indian vs American Unemployment Among Ages 20 to 24 years Correlation Chart
The statistical analysis conducted on geographies consisting of 163,103,975 people shows a moderate positive correlation between the proportion of South American Indians and unemployment rate among population between the ages 20 and 24 in the United States with a correlation coefficient (R) of 0.429 and weighted average of 10.8%. Similarly, the statistical analysis conducted on geographies consisting of 529,663,619 people shows a significant positive correlation between the proportion of Americans and unemployment rate among population between the ages 20 and 24 in the United States with a correlation coefficient (R) of 0.618 and weighted average of 10.6%, a difference of 2.0%.
Unemployment Among Ages 20 to 24 years Correlation Summary
| Measurement | South American Indian | American |
| Minimum | 0.10% | 2.4% |
| Maximum | 25.0% | 100.0% |
| Range | 24.9% | 97.6% |
| Mean | 12.9% | 18.0% |
| Median | 11.4% | 11.4% |
| Interquartile 25% (IQ1) | 9.9% | 10.1% |
| Interquartile 75% (IQ3) | 18.2% | 17.3% |
| Interquartile Range (IQR) | 8.3% | 7.2% |
| Standard Deviation (Sample) | 6.6% | 17.7% |
| Standard Deviation (Population) | 6.5% | 17.6% |
Demographics Similar to South American Indians and Americans by Unemployment Among Ages 20 to 24 years
In terms of unemployment among ages 20 to 24 years, the demographic groups most similar to South American Indians are Cree (10.8%, a difference of 0.20%), Immigrants from Albania (10.8%, a difference of 0.29%), Immigrants from Iran (10.8%, a difference of 0.50%), Hispanic or Latino (10.7%, a difference of 0.63%), and Immigrants from Mexico (10.7%, a difference of 0.82%). Similarly, the demographic groups most similar to Americans are French American Indian (10.6%, a difference of 0.060%), Native Hawaiian (10.6%, a difference of 0.11%), Israeli (10.6%, a difference of 0.17%), Choctaw (10.6%, a difference of 0.19%), and Immigrants from Africa (10.6%, a difference of 0.21%).
| Demographics | Rating | Rank | Unemployment Among Ages 20 to 24 years |
| Americans | 4.4 /100 | #229 | Tragic 10.6% |
| French American Indians | 4.1 /100 | #230 | Tragic 10.6% |
| Native Hawaiians | 3.9 /100 | #231 | Tragic 10.6% |
| Israelis | 3.7 /100 | #232 | Tragic 10.6% |
| Choctaw | 3.6 /100 | #233 | Tragic 10.6% |
| Immigrants | Africa | 3.5 /100 | #234 | Tragic 10.6% |
| Immigrants | Ukraine | 3.3 /100 | #235 | Tragic 10.6% |
| Mexicans | 3.2 /100 | #236 | Tragic 10.6% |
| Immigrants | Immigrants | 2.7 /100 | #237 | Tragic 10.6% |
| Immigrants | Pakistan | 2.6 /100 | #238 | Tragic 10.6% |
| Salvadorans | 2.4 /100 | #239 | Tragic 10.7% |
| Immigrants | Central America | 2.0 /100 | #240 | Tragic 10.7% |
| Immigrants | El Salvador | 1.7 /100 | #241 | Tragic 10.7% |
| Moroccans | 1.4 /100 | #242 | Tragic 10.7% |
| Immigrants | Belarus | 1.3 /100 | #243 | Tragic 10.7% |
| Immigrants | Mexico | 1.2 /100 | #244 | Tragic 10.7% |
| Hispanics or Latinos | 1.0 /100 | #245 | Tragic 10.7% |
| Immigrants | Iran | 0.9 /100 | #246 | Tragic 10.8% |
| Immigrants | Albania | 0.7 /100 | #247 | Tragic 10.8% |
| Cree | 0.6 /100 | #248 | Tragic 10.8% |
| South American Indians | 0.5 /100 | #249 | Tragic 10.8% |