South American Indian vs Albanian Unemployment Among Ages 35 to 44 years
COMPARE
South American Indian
Albanian
Unemployment Among Ages 35 to 44 years
Unemployment Among Ages 35 to 44 years Comparison
South American Indians
Albanians
4.7%
UNEMPLOYMENT AMONG AGES 35 TO 44 YEARS
40.7/ 100
METRIC RATING
178th/ 347
METRIC RANK
4.6%
UNEMPLOYMENT AMONG AGES 35 TO 44 YEARS
63.0/ 100
METRIC RATING
159th/ 347
METRIC RANK
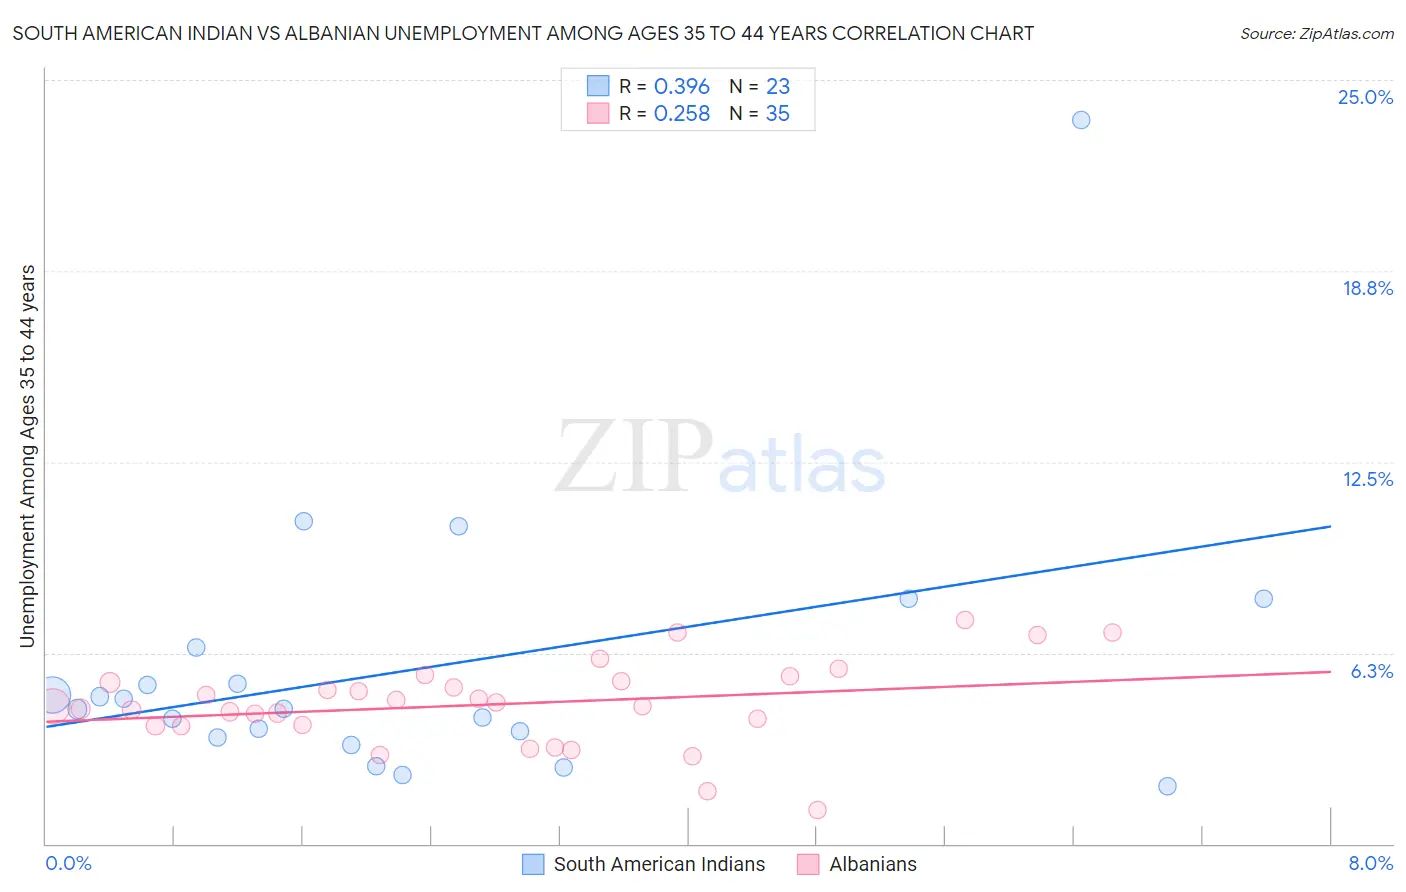
South American Indian vs Albanian Unemployment Among Ages 35 to 44 years Correlation Chart
The statistical analysis conducted on geographies consisting of 163,456,599 people shows a mild positive correlation between the proportion of South American Indians and unemployment rate among population between the ages 35 and 44 in the United States with a correlation coefficient (R) of 0.396 and weighted average of 4.7%. Similarly, the statistical analysis conducted on geographies consisting of 190,928,836 people shows a weak positive correlation between the proportion of Albanians and unemployment rate among population between the ages 35 and 44 in the United States with a correlation coefficient (R) of 0.258 and weighted average of 4.6%, a difference of 1.6%.
Unemployment Among Ages 35 to 44 years Correlation Summary
| Measurement | South American Indian | Albanian |
| Minimum | 1.9% | 1.1% |
| Maximum | 23.7% | 7.3% |
| Range | 21.8% | 6.2% |
| Mean | 5.8% | 4.6% |
| Median | 4.4% | 4.5% |
| Interquartile 25% (IQ1) | 3.5% | 3.9% |
| Interquartile 75% (IQ3) | 6.4% | 5.3% |
| Interquartile Range (IQR) | 2.9% | 1.5% |
| Standard Deviation (Sample) | 4.6% | 1.4% |
| Standard Deviation (Population) | 4.5% | 1.4% |
Demographics Similar to South American Indians and Albanians by Unemployment Among Ages 35 to 44 years
In terms of unemployment among ages 35 to 44 years, the demographic groups most similar to South American Indians are Slovak (4.7%, a difference of 0.28%), Immigrants from Uganda (4.7%, a difference of 0.53%), Immigrants from Germany (4.7%, a difference of 0.59%), Afghan (4.7%, a difference of 0.67%), and Iraqi (4.7%, a difference of 0.73%). Similarly, the demographic groups most similar to Albanians are Immigrants from Iran (4.6%, a difference of 0.010%), Hungarian (4.6%, a difference of 0.030%), Celtic (4.7%, a difference of 0.10%), Costa Rican (4.7%, a difference of 0.26%), and South African (4.7%, a difference of 0.34%).
| Demographics | Rating | Rank | Unemployment Among Ages 35 to 44 years |
| Immigrants | Iran | 63.1 /100 | #158 | Good 4.6% |
| Albanians | 63.0 /100 | #159 | Good 4.6% |
| Hungarians | 62.6 /100 | #160 | Good 4.6% |
| Celtics | 61.7 /100 | #161 | Good 4.7% |
| Costa Ricans | 59.6 /100 | #162 | Average 4.7% |
| South Africans | 58.5 /100 | #163 | Average 4.7% |
| Immigrants | Morocco | 57.2 /100 | #164 | Average 4.7% |
| German Russians | 57.2 /100 | #165 | Average 4.7% |
| French | 55.6 /100 | #166 | Average 4.7% |
| Peruvians | 54.4 /100 | #167 | Average 4.7% |
| Arabs | 53.1 /100 | #168 | Average 4.7% |
| Pennsylvania Germans | 53.0 /100 | #169 | Average 4.7% |
| Immigrants | Indonesia | 52.6 /100 | #170 | Average 4.7% |
| Indonesians | 51.7 /100 | #171 | Average 4.7% |
| Lebanese | 51.4 /100 | #172 | Average 4.7% |
| Iraqis | 50.9 /100 | #173 | Average 4.7% |
| Afghans | 50.0 /100 | #174 | Average 4.7% |
| Immigrants | Germany | 48.9 /100 | #175 | Average 4.7% |
| Immigrants | Uganda | 48.1 /100 | #176 | Average 4.7% |
| Slovaks | 44.6 /100 | #177 | Average 4.7% |
| South American Indians | 40.7 /100 | #178 | Average 4.7% |