Slovene vs Immigrants from Eritrea Unemployment Among Ages 30 to 34 years
COMPARE
Slovene
Immigrants from Eritrea
Unemployment Among Ages 30 to 34 years
Unemployment Among Ages 30 to 34 years Comparison
Slovenes
Immigrants from Eritrea
5.2%
UNEMPLOYMENT AMONG AGES 30 TO 34 YEARS
96.2/ 100
METRIC RATING
73rd/ 347
METRIC RANK
4.7%
UNEMPLOYMENT AMONG AGES 30 TO 34 YEARS
100.0/ 100
METRIC RATING
8th/ 347
METRIC RANK
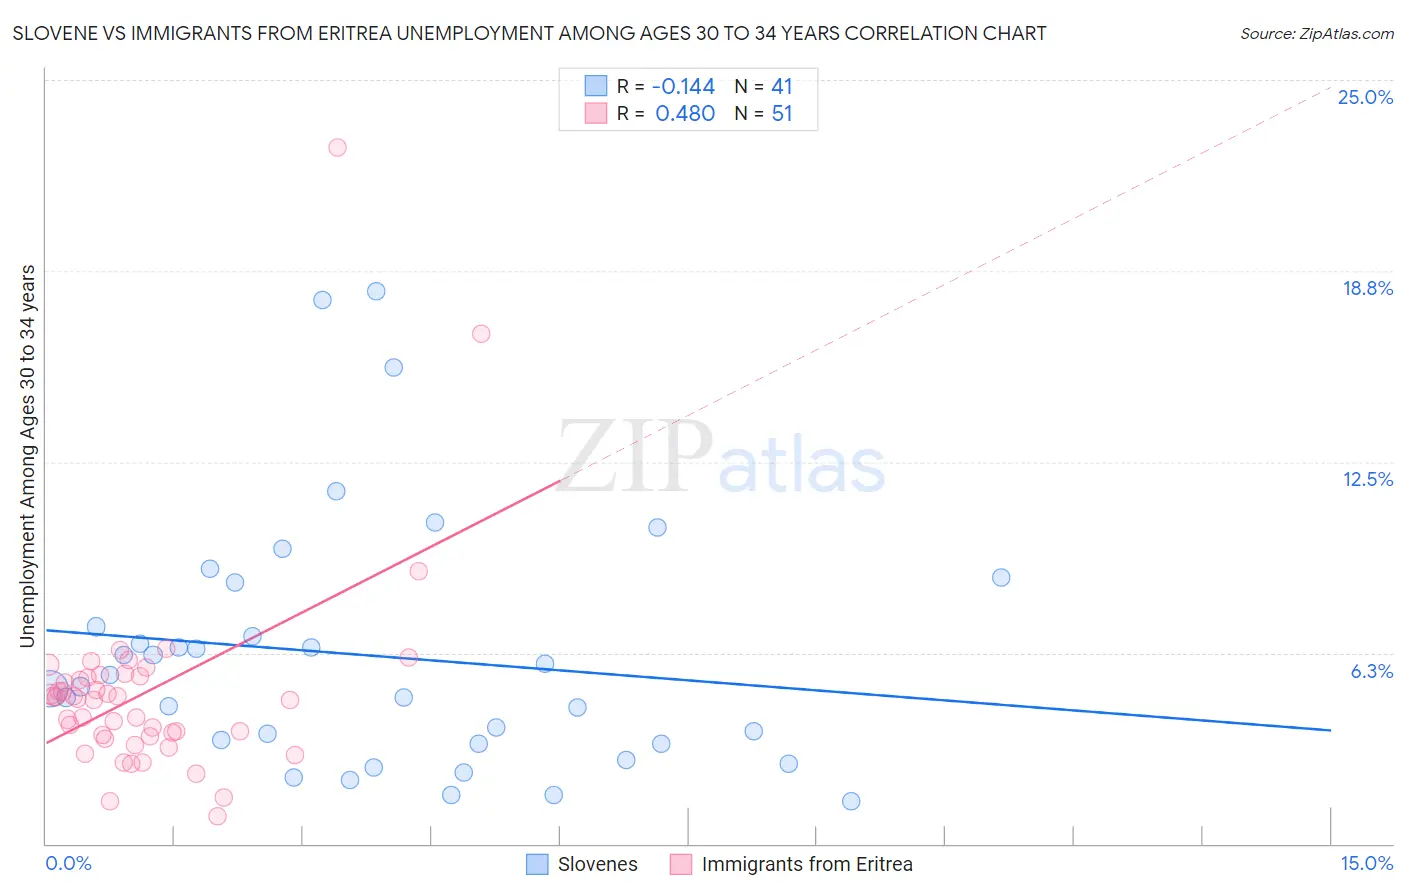
Slovene vs Immigrants from Eritrea Unemployment Among Ages 30 to 34 years Correlation Chart
The statistical analysis conducted on geographies consisting of 247,890,724 people shows a poor negative correlation between the proportion of Slovenes and unemployment rate among population between the ages 30 and 34 in the United States with a correlation coefficient (R) of -0.144 and weighted average of 5.2%. Similarly, the statistical analysis conducted on geographies consisting of 103,521,404 people shows a moderate positive correlation between the proportion of Immigrants from Eritrea and unemployment rate among population between the ages 30 and 34 in the United States with a correlation coefficient (R) of 0.480 and weighted average of 4.7%, a difference of 9.0%.
Unemployment Among Ages 30 to 34 years Correlation Summary
| Measurement | Slovene | Immigrants from Eritrea |
| Minimum | 1.4% | 0.90% |
| Maximum | 18.1% | 22.8% |
| Range | 16.7% | 21.9% |
| Mean | 6.1% | 5.0% |
| Median | 5.1% | 4.7% |
| Interquartile 25% (IQ1) | 3.3% | 3.5% |
| Interquartile 75% (IQ3) | 7.8% | 5.5% |
| Interquartile Range (IQR) | 4.6% | 2.0% |
| Standard Deviation (Sample) | 4.1% | 3.4% |
| Standard Deviation (Population) | 4.0% | 3.4% |
Similar Demographics by Unemployment Among Ages 30 to 34 years
Demographics Similar to Slovenes by Unemployment Among Ages 30 to 34 years
In terms of unemployment among ages 30 to 34 years, the demographic groups most similar to Slovenes are Immigrants from Asia (5.2%, a difference of 0.030%), Immigrants from Moldova (5.1%, a difference of 0.090%), Iranian (5.2%, a difference of 0.090%), Paraguayan (5.1%, a difference of 0.10%), and Immigrants from Northern Africa (5.1%, a difference of 0.11%).
| Demographics | Rating | Rank | Unemployment Among Ages 30 to 34 years |
| Immigrants | Zimbabwe | 96.7 /100 | #66 | Exceptional 5.1% |
| Burmese | 96.5 /100 | #67 | Exceptional 5.1% |
| Jordanians | 96.5 /100 | #68 | Exceptional 5.1% |
| Immigrants | Northern Africa | 96.4 /100 | #69 | Exceptional 5.1% |
| Immigrants | Iraq | 96.4 /100 | #70 | Exceptional 5.1% |
| Paraguayans | 96.4 /100 | #71 | Exceptional 5.1% |
| Immigrants | Moldova | 96.4 /100 | #72 | Exceptional 5.1% |
| Slovenes | 96.2 /100 | #73 | Exceptional 5.2% |
| Immigrants | Asia | 96.2 /100 | #74 | Exceptional 5.2% |
| Iranians | 96.0 /100 | #75 | Exceptional 5.2% |
| Scandinavians | 95.6 /100 | #76 | Exceptional 5.2% |
| Uruguayans | 95.4 /100 | #77 | Exceptional 5.2% |
| Indonesians | 95.1 /100 | #78 | Exceptional 5.2% |
| Immigrants | Lithuania | 95.0 /100 | #79 | Exceptional 5.2% |
| Immigrants | Indonesia | 94.7 /100 | #80 | Exceptional 5.2% |
Demographics Similar to Immigrants from Eritrea by Unemployment Among Ages 30 to 34 years
In terms of unemployment among ages 30 to 34 years, the demographic groups most similar to Immigrants from Eritrea are Thai (4.7%, a difference of 0.18%), Bulgarian (4.7%, a difference of 0.31%), Immigrants from Bosnia and Herzegovina (4.7%, a difference of 0.38%), Tongan (4.8%, a difference of 0.49%), and Immigrants from Bolivia (4.8%, a difference of 0.52%).
| Demographics | Rating | Rank | Unemployment Among Ages 30 to 34 years |
| Immigrants | India | 100.0 /100 | #1 | Exceptional 4.5% |
| Sudanese | 100.0 /100 | #2 | Exceptional 4.6% |
| Immigrants | Venezuela | 100.0 /100 | #3 | Exceptional 4.6% |
| Immigrants | Nepal | 100.0 /100 | #4 | Exceptional 4.7% |
| Venezuelans | 100.0 /100 | #5 | Exceptional 4.7% |
| Immigrants | Bosnia and Herzegovina | 100.0 /100 | #6 | Exceptional 4.7% |
| Thais | 100.0 /100 | #7 | Exceptional 4.7% |
| Immigrants | Eritrea | 100.0 /100 | #8 | Exceptional 4.7% |
| Bulgarians | 99.9 /100 | #9 | Exceptional 4.7% |
| Tongans | 99.9 /100 | #10 | Exceptional 4.8% |
| Immigrants | Bolivia | 99.9 /100 | #11 | Exceptional 4.8% |
| Filipinos | 99.9 /100 | #12 | Exceptional 4.8% |
| Cambodians | 99.9 /100 | #13 | Exceptional 4.8% |
| Luxembourgers | 99.9 /100 | #14 | Exceptional 4.8% |
| Okinawans | 99.9 /100 | #15 | Exceptional 4.8% |