Slovene vs Basque Unemployment Among Ages 16 to 19 years
COMPARE
Slovene
Basque
Unemployment Among Ages 16 to 19 years
Unemployment Among Ages 16 to 19 years Comparison
Slovenes
Basques
16.4%
UNEMPLOYMENT AMONG AGES 16 TO 19 YEARS
99.6/ 100
METRIC RATING
53rd/ 347
METRIC RANK
17.3%
UNEMPLOYMENT AMONG AGES 16 TO 19 YEARS
80.7/ 100
METRIC RATING
141st/ 347
METRIC RANK
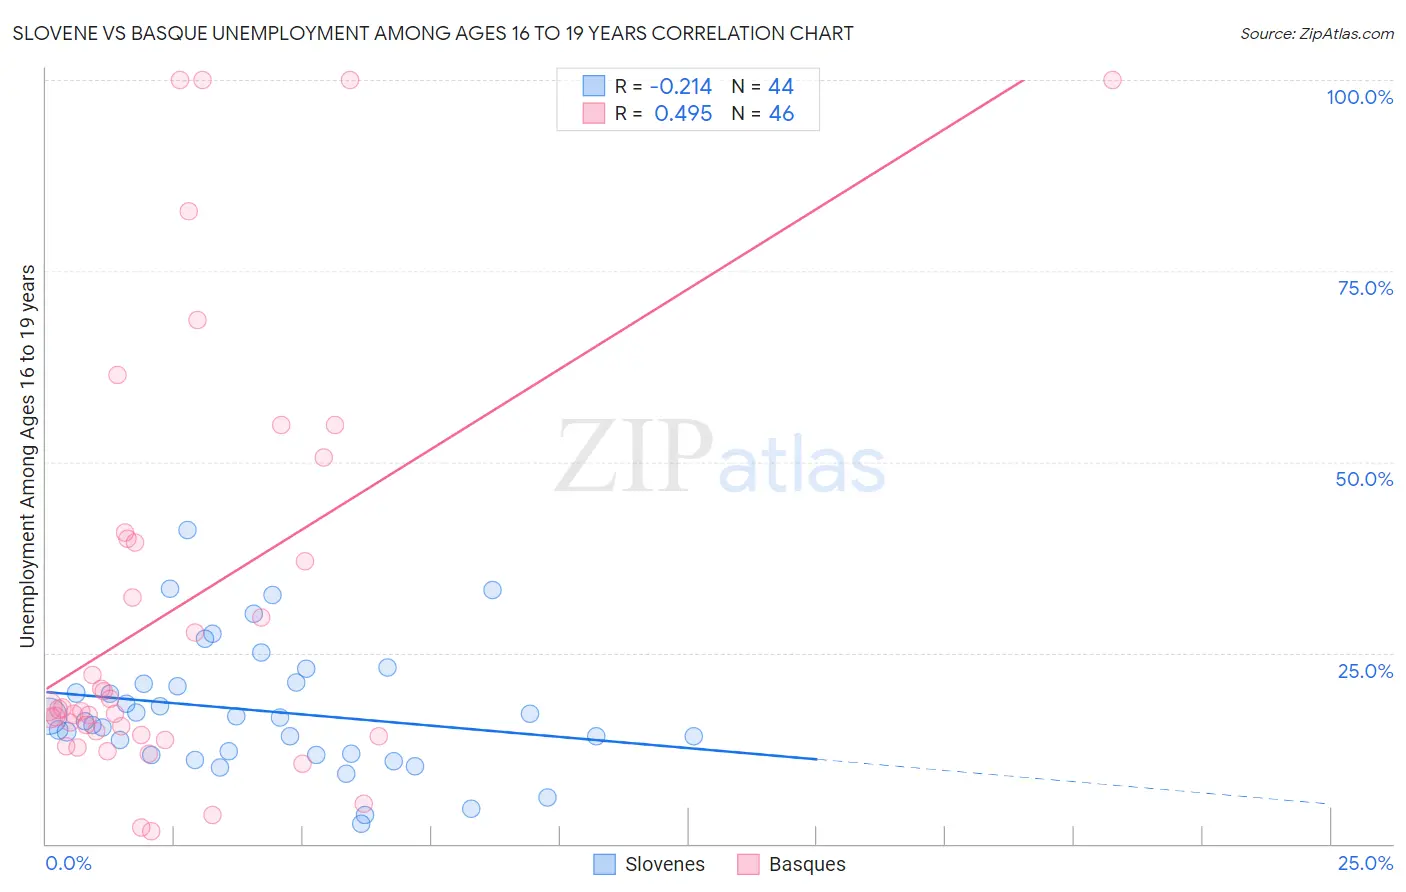
Slovene vs Basque Unemployment Among Ages 16 to 19 years Correlation Chart
The statistical analysis conducted on geographies consisting of 250,202,942 people shows a weak negative correlation between the proportion of Slovenes and unemployment rate among population between the ages 16 and 19 in the United States with a correlation coefficient (R) of -0.214 and weighted average of 16.4%. Similarly, the statistical analysis conducted on geographies consisting of 161,898,143 people shows a moderate positive correlation between the proportion of Basques and unemployment rate among population between the ages 16 and 19 in the United States with a correlation coefficient (R) of 0.495 and weighted average of 17.3%, a difference of 5.1%.
Unemployment Among Ages 16 to 19 years Correlation Summary
| Measurement | Slovene | Basque |
| Minimum | 2.7% | 1.6% |
| Maximum | 41.1% | 100.0% |
| Range | 38.4% | 98.4% |
| Mean | 17.4% | 31.1% |
| Median | 16.3% | 17.7% |
| Interquartile 25% (IQ1) | 11.7% | 14.3% |
| Interquartile 75% (IQ3) | 21.0% | 39.9% |
| Interquartile Range (IQR) | 9.3% | 25.6% |
| Standard Deviation (Sample) | 8.3% | 27.8% |
| Standard Deviation (Population) | 8.2% | 27.5% |
Similar Demographics by Unemployment Among Ages 16 to 19 years
Demographics Similar to Slovenes by Unemployment Among Ages 16 to 19 years
In terms of unemployment among ages 16 to 19 years, the demographic groups most similar to Slovenes are British (16.5%, a difference of 0.050%), Welsh (16.4%, a difference of 0.080%), Czechoslovakian (16.5%, a difference of 0.080%), Sri Lankan (16.5%, a difference of 0.10%), and Lebanese (16.4%, a difference of 0.12%).
| Demographics | Rating | Rank | Unemployment Among Ages 16 to 19 years |
| Immigrants | North Macedonia | 99.7 /100 | #46 | Exceptional 16.4% |
| Immigrants | Vietnam | 99.7 /100 | #47 | Exceptional 16.4% |
| Maltese | 99.7 /100 | #48 | Exceptional 16.4% |
| Iraqis | 99.7 /100 | #49 | Exceptional 16.4% |
| Bhutanese | 99.6 /100 | #50 | Exceptional 16.4% |
| Lebanese | 99.6 /100 | #51 | Exceptional 16.4% |
| Welsh | 99.6 /100 | #52 | Exceptional 16.4% |
| Slovenes | 99.6 /100 | #53 | Exceptional 16.4% |
| British | 99.5 /100 | #54 | Exceptional 16.5% |
| Czechoslovakians | 99.5 /100 | #55 | Exceptional 16.5% |
| Sri Lankans | 99.5 /100 | #56 | Exceptional 16.5% |
| Immigrants | Jordan | 99.4 /100 | #57 | Exceptional 16.5% |
| Immigrants | Uganda | 99.4 /100 | #58 | Exceptional 16.5% |
| Irish | 99.4 /100 | #59 | Exceptional 16.5% |
| Menominee | 99.3 /100 | #60 | Exceptional 16.6% |
Demographics Similar to Basques by Unemployment Among Ages 16 to 19 years
In terms of unemployment among ages 16 to 19 years, the demographic groups most similar to Basques are Immigrants from Croatia (17.3%, a difference of 0.010%), Immigrants from Eritrea (17.3%, a difference of 0.030%), Bolivian (17.3%, a difference of 0.10%), Spanish (17.3%, a difference of 0.11%), and Immigrants from Egypt (17.3%, a difference of 0.12%).
| Demographics | Rating | Rank | Unemployment Among Ages 16 to 19 years |
| Potawatomi | 83.8 /100 | #134 | Excellent 17.2% |
| Samoans | 83.7 /100 | #135 | Excellent 17.2% |
| Immigrants | Oceania | 83.1 /100 | #136 | Excellent 17.2% |
| Immigrants | Malaysia | 82.8 /100 | #137 | Excellent 17.2% |
| Bolivians | 81.9 /100 | #138 | Excellent 17.3% |
| Immigrants | Eritrea | 81.1 /100 | #139 | Excellent 17.3% |
| Immigrants | Croatia | 80.8 /100 | #140 | Excellent 17.3% |
| Basques | 80.7 /100 | #141 | Excellent 17.3% |
| Spanish | 79.3 /100 | #142 | Good 17.3% |
| Immigrants | Egypt | 79.1 /100 | #143 | Good 17.3% |
| Immigrants | England | 78.9 /100 | #144 | Good 17.3% |
| Indians (Asian) | 77.6 /100 | #145 | Good 17.3% |
| Turks | 77.1 /100 | #146 | Good 17.3% |
| Tsimshian | 76.0 /100 | #147 | Good 17.3% |
| Romanians | 74.9 /100 | #148 | Good 17.3% |